The bar graph given below shows percentage distribution of total students (boys + girls) appeared in three exams A, B and C. The bar graph also shows percentage of students (boys + girls) passed in these three exams out of total students (boys + girls) appeared in particular exam. Read the data carefully and answer the questions given below.
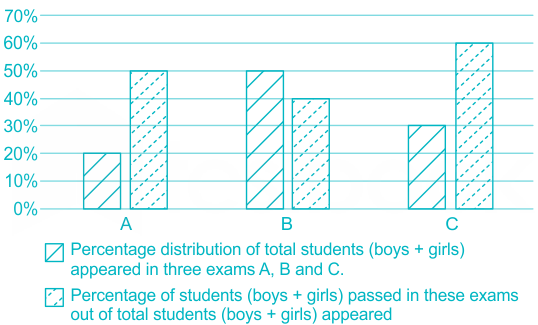
Note:
Total number of students appeared in three exams A, B and C = 900
Total number of students appeared in any exam = students passed + students did not pass.
Out of the number of students who appeared in the examination B, 40% are girls. Out of the number of girls who appeared in examination B, 60 girls did not pass the examination. What is the difference between the number of boys who did not pass the examination and the number of girls who passed the examination?
- AOption (a)
88
- BOption (b)
90
- COption (c)
80
- DOption (d)
70
- EOption (e)
65
View answer & explanationHide answer & explanation
Correct answer
90
Why this answer is correct
Common Calculation
| Exam | Number of students Appeared | Number of students Passed |
|---|---|---|
| A | 900×20/100 = 180 | 180×50/100 = 90 |
| B | 900×50/100 = 450 | 450×40/100 = 180 |
| C | 900×30/100 = 270 | 270×60/100 = 162 |
Students who did not pass:
A: 180 − 90 = 90
B: 450 − 180 = 270
C: 270 − 162 = 108
Calculation:
Total appeared in B = 450
Girls appeared = 40% of 450 = 180
→ Boys appeared = 450 − 180 = 270
Total passed = 180
→ Not passed = 450 − 180 = 270
Girls not passed = 60
→ Boys not passed = 270 − 60 = 210
Girls passed = 180 − 60 = 120
Difference = |210 − 120| = 90
Answer: 90