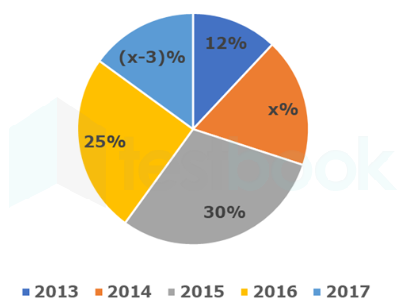
The pie chart shows the percentage distribution of total number of students in science and commerce department of college in five year [ 2013 to 2017]
The pie charts shows the percentage distribution of total number of students in commerce department of college in five year [ 2013 to 2017].
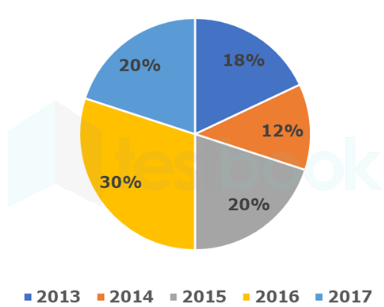
Note –Number of students in 2016 in commerce department is 70 more than the number of students in 2017 in commerce department. In 2017 number of students in commerce department is 40 more than number of students in science department.
Ratio of number of male and female students in 2016 science department is 3:2. Number of female students in 2016 science department is 4m. Find the value of m?
- AOption (a)
29
- BOption (b)
28
- COption (c)
26
- DOption (d)
19
- EOption (e)
27
View answer & explanationHide answer & explanation
Correct answer
19
Why this answer is correct
Number of students in commerce department is 70 more than the number of students in 2017.
So, 30% - 20% = 70
Or, 10% = 70
Or, 100% = 700
So, total number of students in commerce department is 700.
Number of students in commerce department in 2017 is 700 × 20/100 = 140
Number of students in science department in 2017 is 140 – 40 = 100
So, number of student in 2017 in two department together is 140 + 100 = 240.
Total value of pie chart is 100%
So, 12% + x% + 30% + 25% + [x-3]% = 100
Or, 2x = 100 – 12 – 30 -25 +3 = 36
Or, x = 36 /2 = 18
So, Percentage of students in science and commerce department together in 2017 is 18 – 3 = 15%
So, 15% = 240
Or, 100% = [ 240/15] ×100 =1600
| Year | Number of students in science and commerce department | Number of students in commerce department | Number of students in science department |
|---|---|---|---|
| 2013 | 1600 × 12/100 = 192 | 700 ×18/100 = 126 | 192 – 126 = 66 |
| 2014 | 288 | 84 | 204 |
| 2015 | 480 | 140 | 340 |
| 2016 | 400 | 210 | 190 |
| 2017 | 240 | 140 | 100 |
Calculation
Number of female students in 2016 science department is 190 × 2/5 = 76
So, 4m = 76, m = 76 / 4 = 19