Previous Year Paper

SSC CGL Tier-II (JSO ) 2019 Official Paper ( Held On : 17 Nov 2020 ) (Previous Year Paper)

Held in 2019

100 questions120 minutes
With answers
Free

Paper last updated:

Practise under exam conditions

Take this paper as a timed mock test. Review your answers after you submit.

Attempt timed test

Questions & answers

Read the paper at your pace. Open an explanation when you need it.

Quantitative Aptitude (100 questions)

Question 1

The arithematic  average of Edgeworth - Marshal index number

  1. AOption (a)

    Kelly's index number and Walsh's index number

  2. BOption (b)

    Paasche's index number and Fisher's index number

  3. COption (c)

    Laspeyre's index number and Fisher's index number

  4. DOption (d)

    Paasche's index nyumber and Laspeyre's index number

View answer & explanation

Correct answer

Answer: (d)D.

Paasche's index nyumber and Laspeyre's index number

Why this answer is correct

Explanation 

The formula of Marshall and Edgeworth for constructing an index number is called Marshall Edgeworth’s method.\In this method they have suggested to take the arithmetic mean of the quantities of the base year and the current year as the weight of the items.

P01 = {∑[p1(q0 + q1)/2]/∑[po(qo + q1)/2]} × 100

The Marshall – Edgeworth’s index number is given by

∴ P01(ME) = {(∑p1qo + ∑p1q1)}/(∑poqo + ∑poq1)} × 100

The Edgeworth – Marshall method gives a result which is approximately close to the results obtained by the Fisher’s ideal formula, and lies between thye result of Laspeyre and Paasche’s indices

∴ The arithematic average of Paasche’s and Laspeyre’s index number is Edgeworth – Marshall index number

Question 2

The systematic (methodological) arrangement of the statistical data in columns or rows is called:

  1. AOption (a)

    nature of the data 

  2. BOption (b)

    tabulation of the data

  3. COption (c)

    classification of the data

  4. DOption (d)

    categorisation of the data

View answer & explanation

Correct answer

Answer: (b)B.

tabulation of the data

Why this answer is correct

A table is structured for organizing and displaying information with data ordered in row and column.

The object of table is to represent tabular information in a more meaningful way. The object of table is to  represent tabular information in row and olumn to understand the meaning of it in a simple and easy method

∴  The tabulation of th data is the systematic arrangement of the statistical data in columns and rows

Question 3

The chance that a software engineer will debug an error X correctly is 80%. The chance that software with the error X will crash after the correct debugging is 30%. The chance of crash of the software by wrong debugging is 70%. A software with the error X crashed. The probability that its error was debugged correctly is:

  1. AOption (a)

    712\dfrac{7}{12}

  2. BOption (b)

    719\dfrac{7}{19}

  3. COption (c)

    619\dfrac{6}{19}

  4. DOption (d)

    1219\dfrac{12}{19}

View answer & explanation

Correct answer

Answer: (d)D.

1219\dfrac{12}{19}

Why this answer is correct

Given

P(A I B) = 30% = 0.3

P(A) = 80% = 0.8

P(B I A’) = 70% = 0.7

P(A’) = 100% - 80% = 2-0% = 0.2

Formula

P(A I B) = P(A I B). P(A)/P(B) = [P(A I B). P(A)]/[P(A I B). P(A) + P(B I A’) P(A’)]

Calculation

P(A I B) = (0.3 × 0.8)/(0.3 × 0.8 + 0.7 + 0.2)

⇒ 0.24/(0.24 + 0.14)

⇒ 0.24/0.38

∴ The probability that its error was debugged correctly is 12/19

Question 4

The first four raw moments of distribution are 2, 136, 320, and 40,000, The coefficient of skewness is:

  1. AOption (a)

    40656(132)2\dfrac{40656}{(132)^2}

  2. BOption (b)

    (40656)2(132)3\dfrac{(40656)^2}{(132)^3}

  3. COption (c)

    −480(132)2\dfrac{-480}{(132)^2}

  4. DOption (d)

    (−480)2(132)3\dfrac{(-480)^2}{(132)^3}

View answer & explanation

Correct answer

Answer: (d)D.

(−480)2(132)3\dfrac{(-480)^2}{(132)^3}

Why this answer is correct

Given

μ'1, μ2, μ'3, μ'4 are raw moments

μ’1 = 2

μ’2 = 136

μ’3 = 320

μ’4 = 40,000

Calculation

We have to find the first our central moments

μ1 = μ’1 = 2

μ2 = μ’2 – (μ’1)2

⇒ 136 – (2)2

⇒ 136 – 4

⇒ 132

μ3 = μ’3 – 3 × μ’2μ’1 + 2 × (μ’1)3

⇒ 320 – 3 × 136 × 2 + 2 × (2)3

⇒ 320 – 816 + 16

⇒ - 480

μ4 = μ’4 – 4 × μ’1 × μ’3 + 6 × μ’2 × (μ’1)2 – 3 × (μ’1)4

⇒ 40000 – 4 × 2 × 320 + 6 × 136 × 22 – 3 × 24

⇒ 40000 – 2560 + 3264 – 48

⇒ 40656

The coefficient of skewness  denoted by β1

⇒ β1 = μ23/μ32

⇒ (-480)2/(132)3

∴ The coefficient of skewness is (-480)2/(132)3

Question 5

The coefficients of the regression βX|y and βY|x, are known, The coefficient of correlation equals:

  1. AOption (a)

    1βX∣yβY∣x\dfrac{1}{\beta_{X|y}\beta_{Y|x}}

  2. BOption (b)

    ±βX∣yβY∣x\pm\sqrt{{\beta_{X|y}\beta_{Y|x}}}

  3. COption (c)

    21βX∣y+1βY∣x\dfrac{2}{\dfrac{1}{\beta_{X|y}}+\dfrac{1}\beta_{Y|x}{}}

  4. DOption (d)

    βX∣y+βY∣x2\dfrac{\beta_{X|y}+\beta_{Y|x}}{2}

View answer & explanation

Correct answer

Answer: (b)B.

±βX∣yβY∣x\pm\sqrt{{\beta_{X|y}\beta_{Y|x}}}

Why this answer is correct

Explanation

The coefficient of regression is given as = βxIy and βγIx

We know that the coefficient of correlation r = ± √(bxy × byx) where bxy and byx are coefficient of regression

⇒ Similarly from the above options there is only 1 option that satisfied this equation 

∴ The coefficient of correlation is ±βX∣yβY∣x\pm\sqrt{{\beta_{X|y}\beta_{Y|x}}}

Question 6

The approximate harmonic mean of 8, 6, 12, 4 is:

  1. AOption (a)

    5.40

  2. BOption (b)

    4.40

  3. COption (c)

    7.40

  4. DOption (d)

    6.40

View answer & explanation

Correct answer

Answer: (d)D.

6.40

Why this answer is correct

Key Points Harmonic Mean: 

  • The central tendency of a group of numbers is determined using the Harmonic Mean, a type of average.
  • Smaller values in the set are given more weight by the harmonic mean.
  • Since it considers the inverse relationship between two variables, the harmonic mean is very helpful when working with rates or ratios.
  • Harmonic Mean = n / [1/x1 + 1/x2 + 1/x3 + ... + 1/xn]

Important Points 

Given:

n = 4

a = 8, b = 6, c = 12 and d = 4

n = number of observation

a, b, c, d are observations

Formula:

Harmonic mean

= n1a+1b+⋯+1nth term\frac{n}{\frac{1}{a}+\frac{1}{b}+\dots +\frac{1}{n^{th}\ term}}

Calculation:

Harmonic mean

= 418+16+112+14\frac{4}{\frac{1}{8}+\frac{1}{6}+\frac{1}{12}+\frac{1}{4}}

= 43+4+2+624\frac{4}{\frac{3+4+2+6}{24}}

= (24 × 4)/15 = 32/5

= 6.4

∴ The harmonic mean of these observations is 6.40


The harmonic mean is the reciprocal of arithmetic mean

Question 7

For a distribution, the percentile partition values are P10 = 58.983, P50 = 61.345 and P90 = 63.831. Kelly's coefficient of skewness is:

  1. AOption (a)

    0.036

  2. BOption (b)

    0.026

  3. COption (c)

    0.016

  4. DOption (d)

    0.046

View answer & explanation

Correct answer

Answer: (b)B.

0.026

Why this answer is correct

Explanation

Kelly’s skewness denoted by Sk

Sk = P90 + P10 – 2P50

P90, P10, P50 are percentile partition

Calculation

Sk = 63.831 + 58.983 + 2 × 61.345

⇒ 122.814 – 122.69

⇒ 0.124

Kelly’s coefficient of skewness denoted by Sp

SP = (P90 + P10 – 2P50)/P90 – P10

⇒ 0.124/4.848

∴ Kelly’s coefficient of skewness is 0.026

Question 8

For ANOVA two-way classification, to test two types of cloth in fashion trends, we have the following table.

Source of VariationsSSDfMSSF-Ratio
Variety A280214042.04
Variety Bα334.03
Error20β3.33
Total64011

The values of (α, β) are:

  1. AOption (a)

    (240, 4)

  2. BOption (b)

    (240, 6)

  3. COption (c)

    (340, 6)

  4. DOption (d)

    (340, 4)

View answer & explanation

Correct answer

Answer: (c)C.

(340, 6)

Why this answer is correct

Formula

SSA + SSB + SSE = TOTAL

Df A + Df B + Df E = Total

SSA = Sum of square of variety A

SSB = Sum of square of variety B

SSE = Sum of square of error \Df = Degree of freedom

Calculation

According to question

⇒ 280 + α + 20 = 640

⇒ α  = 640 - 300

∴ α  = 340

⇒ 2 + 3 + β = 11

⇒ β = 11 - 5

∴ β = 6

∴ The value of α and β are 340, 6

Question 9

The PDF of babies’ age is defined as f(x)=34x(2−x);0<x<2f(x)=\dfrac{3}{4}x(2-x);0<x<2, The 5th decile point of X is:

  1. AOption (a)

    1

  2. BOption (b)

    32\dfrac{3}{2}

  3. COption (c)

    54\dfrac{5}{4}

  4. DOption (d)

    34\dfrac{3}{4}

View answer & explanation

Correct answer

Answer: (a)A.

1

Why this answer is correct

Expalantion

For the 5th Decile = \% MathType!Translator!2!1!AMS LaTeX.tdl!AMSLaTeX! \% MathType!MTEF!2!1!+- \% feaahqart1ev3aqatCvAUfeBSjuyZL2yd9gzLbvyNv2CaerbuLwBLn \% hiov2DGi1BTfMBaeXatLxBI9gBaerbd9wDYLwzYbItLDharqqtubsr \% 4rNCHbGeaGqiVu0Je9sqqrpepC0xbbL8F4rqqrFfpeea0xe9Lq-Jc9 \% vqaqpepm0xbba9pwe9Q8fs0-yqaqpepae9pg0FirpepeKkFr0xfr-x \% fr-xb9adbaqaaeGaciGaaiaabeqaamaabaabaaGcbaaeaaaaaaaaa8 \% qadaGfWbqabSWdaeaapeGaaGimaaWdaeaapeGaaGOmaaqdpaqaa8qa \% cqGHRiI8aaacbmGccaWFMbWaaeWaa8aabaWdbiaa-HhaaiaawIcaca \% GLPaaacaWFKbGaa8hEaiabg2da9iaaiwdacaGGVaGaaGymaiaaicda \% aaa!43C1! \mathop \smallint \limits_0^2 f\left( x \right)dx = 5/10\% MathType!End!2!1!

Calculation

\% MathType!Translator!2!1!AMS LaTeX.tdl!AMSLaTeX! \% MathType!MTEF!2!1!+- \% feaahqart1ev3aqatCvAUfeBSjuyZL2yd9gzLbvyNv2CaerbuLwBLn \% hiov2DGi1BTfMBaeXatLxBI9gBaerbd9wDYLwzYbItLDharqqtubsr \% 4rNCHbGeaGqiVu0Je9sqqrpepC0xbbL8F4rqqrFfpeea0xe9Lq-Jc9 \% vqaqpepm0xbba9pwe9Q8fs0-yqaqpepae9pg0FirpepeKkFr0xfr-x \% fr-xb9adbaqaaeGaciGaaiaabeqaamaabaabaaGcbaaeaaaaaaaaa8 \% qadaGfWbqabSWdaeaapeGaaGimaaWdaeaapeGaaeiraiaaiwdaa0Wd \% aeaapeGaey4kIipaaOGaaG4maiaac+cacaaI0aGaamiEamaabmaapa \% qaa8qacaWG4bGaeyOeI0IaaGOmaaGaayjkaiaawMcaaiaadsgacaWG \% 4baaaa!448B! \mathop \smallint \limits_0^{{\text{D}}5} 3/4x\left( {x - 2} \right)dx = = ¾(2x2/2 – x3/3)0d5

⇒ 5/10 = ¾(2D52/2 – D53/3)

Putting the values of D5, Put the value of D5 in the equation, the value which satisfy the equation will become the answer of this question

Option 1 – (1)

⇒ ¾(2 × (1)2/2– (1)3/3)

⇒ ¾(1 – 1/3

⇒ ¾(2/3) = ½ or 5/10

∴ Option 1 satisfy the equation hence 5th decile point of X is 1

Question 10

The interquartile range of continuous random variable X having PDF f(x) = e-x; x ≥ 0 is:

  1. AOption (a)

    In12\rm In\dfrac{1}{2}

  2. BOption (b)

    In 3

  3. COption (c)

    In 2

  4. DOption (d)

    In13\rm In\dfrac{1}{3}

View answer & explanation

Correct answer

Answer: (b)B.

In 3

Why this answer is correct

Given

F(x) = e-x

Calculation

 For Q3=∫0Q3e−xdx=75100Q_3=\displaystyle\int^{Q_3}_0e^{-x}dx=\dfrac{75}{100}

⇒ ¾ = (-e-x)Q30

⇒ ¾ = (-1 – e-Q3)

⇒ ¼ = e-Q3

⇒Q3 = In 4

For Q1=∫0Q1e−xdx=25100Q_1=\displaystyle\int^{Q_1}_0e^{-x}dx=\dfrac{25}{100}

⇒ (-e-xdx)Q10 = 1/4

⇒ (- 1 – e-Q1) = ¼

⇒ Log Q1 = ¾

Q1 = In 4/3

⇒ Interquartile range = Q3 – Q1

⇒ In 4 – In 4/3

⇒ In  4 –(In 4 – In 3)

∴ The interquartile range is In 3

The Probability density function = ∫0∞f(x) dx=1\displaystyle\int_0^\infty f(x)\ dx=1

Question 11

If an event B has occurred and has P(B) = 1, the conditional probability P(A|B) is equal to:

  1. AOption (a)

    0

  2. BOption (b)

    P(A)

  3. COption (c)

    P(B)

  4. DOption (d)

    1

View answer & explanation

Correct answer

Answer: (b)B.

P(A)

Why this answer is correct

Explanation

If the event B occurs does not change the probability that event A occurs, and event A and B are the independent event then

⇒ P(A I B) = P(A)

According to bayes’s theorem It states the relation between the probabilities of A and B, P(A) and P(B) and the conditional probabilities of A gives B and B gives A.

⇒ P(A I B) and P(B I A)

⇒ P(A I B) = P(B I A).P(A)/P(B)

⇒ P(B I A) = P(A ∩ B)/P(A)

⇒ P(A ∩ B) = P(A).P(B)

⇒ P(A I B) = P(A ∩ B).P(A)/P(A). P(B)

⇒ P(A I B) = P(A). P(B).P(A)/P(A).P(B)

⇒ P(A I B) = P(A)

∴ The value of P(A I B) is P(A)

Question 12

''The experiment is repeated an extremely large number of times of probability.'' This approach is known as:

  1. AOption (a)

     (Classical approach)

  2. BOption (b)

    (Objective approach)

  3. COption (c)

    (Relative frequency approach)

  4. DOption (d)

    (Subjective approach)

View answer & explanation

Correct answer

Answer: (c)C.

(Relative frequency approach)

Why this answer is correct

Explanation

The relative frequency theory of probability holds that if an experiment is repeated an extremely large number of times and a particular outcome occurs a percentage

of the time, then that particular percentage is close to the probability of that outcome.

Let A be an event of interest and assume that we have performed the same experiment n times so that n is the number of times A could have occurred

∴ The experimenta is repeated an extremely large number of times of probability and this approach is known as Relative frequency approach


Classical approach = : based on equally likely events. If an experiment has n possible outcomes, this method would assign a probability of 1/n to each outcome.

It is necessary to determine the number of possible outcomes

Subjective approach = “In the subjective approach we define probability as the degree of belief that we hold in the occurrence of an event”

Objective probability refers to the chances or the odds that an event will occur based on the analysis of concrete measures rather than hunches or guesswork. ...

An independent event is an event whose outcome is not influenced by prior events

Question 13

A box contains four soccer balls printed with numbers 112, 121, 211. 222. A footballer chooses one ball at random. Let A1 be the event that the first digit of the printed number of the ball chosen is 1. Similarly, A2 and A3 denote that second as well as third digit of the printed number is 1. The events A1,A2, and A3 are:

  1. AOption (a)

    independent events

  2. BOption (b)

    dependent events

  3. COption (c)

    pairwise independent events

  4. DOption (d)

    mutually exclusive events

View answer & explanation

Correct answer

Answer: (c)C.

pairwise independent events

Why this answer is correct

Explanation

The events are called pairwise independent if any two events in the collection are independent of each other, while saying that the event are mutually independent

(or collectively  independent) it means that each event is independent of any combination of other events in the collection.

∴ Events, A1, A2, and A3 are pairwise independent events

Question 14

Let X be a standard normal distribution. The value of E (X3) is:

  1. AOption (a)

    (t3+3t)et22(t^3+3t)e^{\frac{t^2}{2}}

  2. BOption (b)

    t3et22t^3e^{\frac{t^2}{2}}

  3. COption (c)

    et22e^{\frac{t^2}{2}}

  4. DOption (d)

    0

View answer & explanation

Correct answer

Answer: (d)D.

0

Why this answer is correct

Explanation

The probability distribution function of Normal distribution us was given as

⇒ F(x) =[1/σ√2π ]e-(x – μ)2/2σ2

If we put Z = (x – μ)/σ in Normal distribution then it is called a standard normal distribution

The probability distribution function of the standard normal distribution is as follows

⇒ f(x) = [1/σ√2π]e- z^2/2

The value of E(X3) in a standard normal distribution is 0


The standard deviation of normal distribution  = σ = 1

The coefficient of skewness of Normal distribution is β1 = 0

The coefficient of kurtosis in normal distribution is β3 = 3

Question 15

A chemical experiment was conducted to test the effects of three methods of purification of water on the pH factor. It was felt that climatic condition also affects the pH of water. The water body was divided into four blocks. A block represented a particular kind of climatic condition. At each block, three areas of equal volume were taken. The three areas at each block were assigned at random to the three methods of purification. The impurities, in ppm, were recorded. If P(F≤Fn1.n2.1−α)=1−αP(F\le F_{n_1.n_2.1-\alpha})=1-\alpha, the critical region to test the equality of mean purification of three methods at a 5% level of significance by randomised block design is:

  1. AOption (a)

    F ≥ F2,6,0.95

  2. BOption (b)

    F ≥ F2,3,0.95

  3. COption (c)

    F ≥ F2,30.05

  4. DOption (d)

    F ≥ F3,6,0.95

View answer & explanation

Correct answer

Answer: (a)A.

F ≥ F2,6,0.95

Why this answer is correct

Given

α = level of significant = 5% = 0.05

R = Row = 3

C = Column = Block = 4

Calculation

n1 = R - 1

⇒ n1 = 3 - 1 

⇒ 2

n2 = (R - 1)(C - 1)

⇒ (3 - 1)(4 - 1)

⇒ n2 = 2 × 3

⇒ n2 = 6

F ≤ Fn1,n2, 1 - α 

⇒ F≤ F(R - 1),(R - 1)(C - 1),1 - α

⇒ F≤ F2,6,0.95

∴ the critical region to test the equality of mean purification of three methods at a 5% level of significance by randomised block design is F≤ F2,6,0.95

Question 16

In tossing a coin, let the probability of turning up a head be p . The hypotheses are H0 ∶ p = 0.4 vs H1 ∶ p = 0.6. H0 is rejected if there are five or more heads in six tosses. Then the power of the test is:

  1. AOption (a)

    0.233

  2. BOption (b)

    0.767

  3. COption (c)

    0.333

  4. DOption (d)

    0.762

View answer & explanation

Correct answer

Answer: (a)A.

0.233

Why this answer is correct

Formula 

In Binomial distribution f(x) = ncxpxqn - x

q = 1 - p

p = Probability of success of event

q = probability of failure of event

Calculation

n = 6

x = 5

⇒ The power of the test = 6c5(0.6)5(0.4)6 - 5 + 6c6(0.6)6(0.4)6 - 6

⇒ (6!/5!(6 - 5)!5(0.4)1 + 6c6(0.6)6(0.4)0

⇒ 6 × (0.6)5 × 0.4 + (0.6)6 × 1

⇒ (0.6)5[6 × 0.4 + 0.6]

⇒ (0.6)5[2.4 + 0.6]

∴ The power of test is 0.233

Question 17

Patients arrive at a clinic following the Poisson process, with the mean rate of 10 customers per hour. The inter-arrival time of a customer follows:

  1. AOption (a)

    Geometric distribution

  2. BOption (b)

    Poisson distribution

  3. COption (c)

    Exponential distribution 

  4. DOption (d)

    Gamma distribution

View answer & explanation

Correct answer

Answer: (c)C.

Exponential distribution 

Why this answer is correct

Explanation

The exponential distribution is often concerned with the amount of time until some specific event occurs. It is the probability distribution of the time between events in

a poisson point process. The exponential distribution are commonly used in calculations of product reliability or the length of time a product tasts.


Geometric distribution = The geometric distribution represents the number of failures before you get a success in a series of Bernoulli trials. This discrete probability distribution is represented by the probability density function:

f(x) = (1 − p)x − 1p

Normal distribution = A continuous random variable X is said to follow normal distribution with parameters μ(-  ∞ <  μ <  ∞) and σ2 (> 0) if it takes on any real value and its probability density function.

Gamma distribution = if n > 0, the integral ∫ 0 to ∞ is called gamma function and t is denoted by f(n̅)

Question 18

Calculate Laspeyres price index for the year 2020 from the following data.

CommoditiesQuantitiesPrice per unit
2019202020192020
A461.01.5
B571.52.0
C342.01.5
  1. AOption (a)

    111.14

  2. BOption (b)

    117.14

  3. COption (c)

    113.14

  4. DOption (d)

    115.14

View answer & explanation

Correct answer

Answer: (b)B.

117.14

Why this answer is correct

Given

CommoditiesQuantitiesPrice per unitPoQ0P1Q0
2019(QO)2020(Q1)2019(P0)2019(P1)
A4611.546
B571.527.510
C3421.564.5
TotalΣP0Q0 = 17.5∑P1Qo = 20.5

Formula

Laspeyres price index = (∑p1qo/∑p0q0) × 100

P1 = current year

P0 = base year

q0 =  base quantity

Calculation

Laspeyres price index for year 2020

⇒ (20.5/17.5) × 100

∴ Laspeyres price index for year 2020 is 117.14

Question 19

If the data are skewed, which option of central tendency measure is the most unreliable indicator?

  1. AOption (a)

    Mean

  2. BOption (b)

    Median

  3. COption (c)

    Range

  4. DOption (d)

    Mode

View answer & explanation

Correct answer

Answer: (a)A.

Mean

Why this answer is correct

Explanation

The mean is the most popular and well-known measure of central tendency. It can be used with both discrete and continuous data. Although its use is most often 

with continuous data. The mean is equal to the sum of all the values in the data set divided b the number of values in the data set

Mean = ∑xi/N

N = number of observation

X = observation

Median = Median locates a central part which divides a distribution into two equal halves

Median = (N + 1/2) th item, N = number of observation

Mode = Mode refers that value in a distribution which occur most frequently 

Mode = Mo = L + [(F1 - FO)/(2F1 - FO -  F2)] \TIMES C

C = Size of the interval

F1 = Frequency of the modal class

F2 = Frequency of the class succeeding the modal class

F0 = Frequency of the class preceding the modal class

L = Lower limit of the modal class

Confusion Points

  • Range is a measure of dispersion.
  • Central tendency has three measures - Mean, Median and Mode.

Question 20

If μ4, = 199, μ3 = 50 and μ2 = 8, then the value of excess kurtosis is:

  1. AOption (a)

    1.109

  2. BOption (b)

    0.109

  3. COption (c)

    3.109

  4. DOption (d)

    2.109

View answer & explanation

Correct answer

Answer: (b)B.

0.109

Why this answer is correct

Given

μ4 = 199

μ3 = 50

μ2 = 8

Formula

Kurtosis a4= μ4/(μ2)2

Excess kurtosis = a4 – 3

Calculation

a4 = 199/(8)2

⇒ 199/64

⇒ 3.109

⇒ Excess kurtosis is denoted by g2

⇒ g2 = a4 – 3

⇒ 3.109 – 3

∴ Excess kurtosis is 0.109

Question 21

The report indicated that in 2020 the occurrence of smoking among adults was 21.1%. Data is collected from dominant smoking in n = 3,536 participants who attended the seventh examination of the offspring in the Framingham. Study indicated that 482 out of 3.536 Le. 13.6% of the respondents were currently smoking at the time of the exam. We want to test whether the occurrence of smoking is lower in the Framingham Offspring sample, given the focus on cardiovascular health in that community. The value of appropriate test statistic is:

  1. AOption (a)

    -1.93

  2. BOption (b)

    1.093

  3. COption (c)

    1.93

  4. DOption (d)

    -10.93

View answer & explanation

Correct answer

Answer: (d)D.

-10.93

Why this answer is correct

Concept used

Ho: p < po

Z = (ṗ - po)/[√po(1 – po)/n]

Given

P = 0.136

Po = 0.211

n = 3,536

Calculation

Z = (0.136 – 0.211)/√[0.211(1 – 0.211)/3536]

⇒ (- 0.075)/√(0.166479/3536)

⇒ (0.075)/√0.0000047

⇒ = -10.93

∴ The value of appropriate test statistic is – 10.93

Question 22

If the Bowley’s coefficient of skewness is less than zero, then the distribution is:

  1. AOption (a)

    positively-skewed

  2. BOption (b)

    negatively-skewed

  3. COption (c)

    symmetric

  4. DOption (d)

    can’t be determined

View answer & explanation

Correct answer

Answer: (b)B.

negatively-skewed

Why this answer is correct

Explanation

Bowley’s coefficient of skewness is based on the quartile. The formula for calculating coefficient of skewness is given by

⇒ Sk = [(Q3 – Q2) – (Q2 – Q1)]/(Q3 – Q1)

⇒ (Q3 – 2Q­2 + Q1)/(Q3 – Q­1)

The value of Sk would be zero, if it is a symmetrical distribution

If the value is less than zero, then it is negatively skewed distribution

It will take value between + 1 and - 1

Question 23

Among these options, which one is NOT an example of relative measure of dispersion?

  1. AOption (a)

    Variance

  2. BOption (b)

    Coefficient of variation

  3. COption (c)

    Coefficient of standard deviation

  4. DOption (d)

    Coefficient of quartile deviation

View answer & explanation

Correct answer

Answer: (a)A.

Variance

Why this answer is correct

Explanation

Examples of relative measure of dispersion are

⇒ Coefficient of standard deviation

⇒ Variation

⇒ Quartile deviation

∴ variance is not an example of relative measure of dispersion


Standard deviation = σ = ∑(xi – x̅)/n

Variance = σ2 = average squared devation of value of mean

Variance is calculate after squaring in the standard deviation so it does not have the same unit.

Question 24

The data taken from the published report on “Dropouts From School’ will be considered as:

  1. AOption (a)

    primary and secondary data

  2. BOption (b)

    neither primary nor secondary data

  3. COption (c)

    primary data

  4. DOption (d)

    secondary data

View answer & explanation

Correct answer

Answer: (d)D.

secondary data

Why this answer is correct

The sources from where we get information are called data sources and these may comprise documents, humans, institutions as well as mass media like newspapers, radio, television, etc.

  • All recorded sources of information irrespective of their contents and forms come under documentary sources which can be categorized based on their content into primary, secondary, and tertiary sources of data.

Key Points

  • Secondary data refers to data that is collected by someone other than the primary user.
  • It means that the information is already available, and someone analyses it.
  • The secondary sources include magazines, newspapers, books, journals, censuses information collected by the government dept, organizational records, and data that was originally collected for other research purposes.
  • For example, Suppose we want to know the number of persons in different income groups in a particular village. For this, the figures will be available with the Municipality / Panchayat Office. This is an example of data collected from secondary sources.

Hence, the data taken from the published report on dropouts from school will be considered as secondary data.

Hint

  • Primary Sources refer to the sources which contain original/first-hand material or fresh information.

Question 25

For a distribution of student’s height, the moments are 60.125, 61.345, 62.688. The absolute measure of skewness is:

  1. AOption (a)

    0.321

  2. BOption (b)

    0.312

  3. COption (c)

    0.231

  4. DOption (d)

    0.123

View answer & explanation

Correct answer

Answer: (d)D.

0.123

Why this answer is correct

Given

μ1 = 60.125

μ2 = 61.345

μ3 = 62.688

Calculation

Skewness coefficient is denoted by β1

⇒ β1 = (μ3)2/(μ2)2

⇒ (62.688)2/(61.345)3 

⇒β1 = 0.0170

Absolute skewness measurement = γ1

⇒ γ1 = √(β1)

⇒ √(0.0170)

∴ Absolute skewness measurement is 0.123

Question 26

Let X and Y be two jointly continuous random variables with joint pdf fxy (x, y) = 10x2y; 0 ≤ y ≤ x ≤ 1. The marginal density fγ (y) is:

  1. AOption (a)

    103y3(1−y);0≤y≤1\dfrac{10}{3}y^3(1-y);0 \le y \le1

  2. BOption (b)

    103y(1−y2);0≤y≤1\dfrac{10}{3}y(1-y^2);0 \le y \le1

  3. COption (c)

    103y2(1−y2);0≤y≤1\dfrac{10}{3}y^2(1-y^2);0 \le y \le1

  4. DOption (d)

    103y(1−y3);0≤y≤1\dfrac{10}{3}y(1-y^3);0 \le y \le1

View answer & explanation

Correct answer

Answer: (d)D.

103y(1−y3);0≤y≤1\dfrac{10}{3}y(1-y^3);0 \le y \le1

Why this answer is correct

Given

Fxy(x, y) = 10x2y, 0 ≤ y ≤ x ≤ 1

Concept used

Marginal probability is the probability of an event irrespective of the outcome of another variable.

Calculation

Marginal density fy(y) = %MathType!MTEF!2!1!+−%feaahqart1ev3aqatCvAUfeBSjuyZL2yd9gzLbvyNv2CaerbuLwBLn%hiov2DGi1BTfMBaeXatLxBI9gBaerbd9wDYLwzYbItLDharqqtubsr%4rNCHbGeaGqiVu0Je9sqqrpepC0xbbL8F4rqqrFfpeea0xe9Lq−Jc9%vqaqpepm0xbba9pwe9Q8fs0−yqaqpepae9pg0FirpepeKkFr0xfr−x%fr−xb9adbaqaaeGaciGaaiaabeqaamaabaabaaGcbaaeaaaaaaaaa8%qacqGHRiI8ieWacaWFMbWaaeWaa8aabaWdbiaa−HhacaGGSaGaa8hO%aiaa−LhaaiaawIcacaGLPaaacaWFKbGaa8hEaaaa!401C!∫f(x,;y)dx\% MathType!MTEF!2!1!+- \% feaahqart1ev3aqatCvAUfeBSjuyZL2yd9gzLbvyNv2CaerbuLwBLn \% hiov2DGi1BTfMBaeXatLxBI9gBaerbd9wDYLwzYbItLDharqqtubsr \% 4rNCHbGeaGqiVu0Je9sqqrpepC0xbbL8F4rqqrFfpeea0xe9Lq-Jc9 \% vqaqpepm0xbba9pwe9Q8fs0-yqaqpepae9pg0FirpepeKkFr0xfr-x \% fr-xb9adbaqaaeGaciGaaiaabeqaamaabaabaaGcbaaeaaaaaaaaa8 \% qacqGHRiI8ieWacaWFMbWaaeWaa8aabaWdbiaa-HhacaGGSaGaa8hO \% aiaa-LhaaiaawIcacaGLPaaacaWFKbGaa8hEaaaa!401C! \smallint f\left( {x,;y} \right)dx

⇒ \% MathType!MTEF!2!1!+- \% feaahqart1ev3aqatCvAUfeBSjuyZL2yd9gzLbvyNv2CaerbuLwBLn \% hiov2DGi1BTfMBaeXatLxBI9gBaerbd9wDYLwzYbItLDharqqtubsr \% 4rNCHbGeaGqiVu0Je9sqqrpepC0xbbL8F4rqqrFfpeea0xe9Lq-Jc9 \% vqaqpepm0xbba9pwe9Q8fs0-yqaqpepae9pg0FirpepeKkFr0xfr-x \% fr-xb9adbaqaaeGaciGaaiaabeqaamaabaabaaGcbaaeaaaaaaaaa8 \% qadaqfWaqabSWdaeaaieWapeGaa8hEaiabg2da9iaa-Lhaa8aabaWd \% biaaigdaa0WdaeaapeGaey4kIipaaaaa!3C61! \mathop \smallint \nolimits_{x = y}^1 (10x2ydx

After integration we get

⇒ 10y(x3/3)1x = y

⇒ (10y/3)(1 - y3)

∴ The marginal density fγ (y) is (10y/3)(1 - y3).

Question 27

For the moderately symmetrical distribution of age of the employees, mean = 20 and mode = 25. The approximate value of the median is:

  1. AOption (a)

    211321\dfrac{1}{3}

  2. BOption (b)

    212321\dfrac{2}{3}

  3. COption (c)

    221322\dfrac{1}{3}

  4. DOption (d)

    222322\dfrac{2}{3}

View answer & explanation

Correct answer

Answer: (b)B.

212321\dfrac{2}{3}

Why this answer is correct

Given

Mean = 20

Mode  = 25

Formula

3 × Median = Mode + 2 × Mean

Calculation

Median = (Mode + 2 Mean)/3

⇒ (25 + 2 × 20)/3

⇒ (25 + 40)/3

⇒ 65/3

∴ Median = 21 2/3

Question 28

A and B are two events.A̅and B̅ are their complement events, respectively, such that AB̅ and AB are two mutually exclusive and exhaustive events in which the event A can occur. Then which option is correct?

  1. AOption (a)

    P(A) = P(A̅B) + P(AB̅)

  2. BOption (b)

    P(A) = P(AB) + P(AB̅)

  3. COption (c)

    P(A) = P(A̅) + P(AB̅)

  4. DOption (d)

    P(A) = 1

View answer & explanation

Correct answer

Answer: (b)B.

P(A) = P(AB) + P(AB̅)

Why this answer is correct

Explanation

If A and B are two event and A̅  and B̅ are their complementary events

AB̅ and AB are two mutually exclusive and exhaustive events then

∴ P(A) = P(AB) + P(AB̅)

Question 29

The rise in the number of patients due to heatstroke is an example of:

  1. AOption (a)

    Seasonal variation

  2. BOption (b)

    cyclical variation

  3. COption (c)

    irregular variation

  4. DOption (d)

    Secular variation

View answer & explanation

Correct answer

Answer: (a)A.

Seasonal variation

Why this answer is correct

Explanation

Heartstroke is a condition caused by your body overheating, usually as a result of prolonged exposure to or physical exertion in high temperature.

This most serious form of heat injury, heartstroke can occur if your body temperature rises to 104° F or higher. 

∴ This condition is most common in the summer months. It is an example of seasonal variation

Question 30

According to government data, 24 percent of teenagers in India under the age of 18 years live in households with incomes that are classified at a particular income level. A simple random sample of 400 teenagers in India under the age of 18 years was selected for a study of learning. If the government data is correct, which of the following best approximates the probability that at least 27 per cent of the teenagers in the sample live in households that are classified at a particular income level?

  1. AOption (a)

    P(z>0.24−0.27(0.24)(0.76)400)P\left(z>\dfrac{0.24-0.27}{\sqrt{\dfrac{(0.24)(0.76)}{400}}}\right)

  2. BOption (b)

    P(z>0.27−0.24(0.50)(0.50)400)P\left(z>\dfrac{0.27-0.24}{\sqrt{\dfrac{(0.50)(0.50)}{400}}}\right)

  3. COption (c)

    P(z>0.27−0.24(0.27)(0.73)400)P\left(z>\dfrac{0.27-0.24}{\sqrt{\dfrac{(0.27)(0.73)}{400}}}\right)

  4. DOption (d)

    P(z>0.27−0.24(0.24)(0.76)400)P\left(z>\dfrac{0.27-0.24}{\sqrt{\dfrac{(0.24)(0.76)}{400}}}\right)

View answer & explanation

Correct answer

Answer: (d)D.

P(z>0.27−0.24(0.24)(0.76)400)P\left(z>\dfrac{0.27-0.24}{\sqrt{\dfrac{(0.24)(0.76)}{400}}}\right)

Why this answer is correct

Concept used

Ho: p < po

Z = (ṗ - po)/[√po(1 – po)/n]

Given

P = 0.27

Po = 0.24

n = 400

Calculation

Z = (ṗ - po)/[√po(1 – po)/n]

⇒ (0.27 - 0.24)/√[(0.24)(0.76)/400]

∴ Now required probability, P(Z > (0.27 - 0.24)/√[(0.24)(0.76)/400]

Question 31

Which index satisfies the factor reversal test?

  1. AOption (a)

    Laspeyre's Index

  2. BOption (b)

    Fisher's ideal index

  3. COption (c)

    Walsh price index

  4. DOption (d)

    Paasche's index

View answer & explanation

Correct answer

Answer: (b)B.

Fisher's ideal index

Why this answer is correct

Explanation

For factor reversal test

P01 × Q01 = ∑P1Q1/∑P0Q0

⇒ P01  = √[(∑(p1qo/∑poqo) × (∑p1q1/∑poq1]

⇒ Q01 = √[(p0q1/∑p0q0) × (∑p1q1/∑p1q0)

⇒ P01 × Q01 = √[(∑(p1qo/∑poqo) × (∑p1q1/∑poq1) × (p0q1/∑p0q0) × (∑p1q1/∑p1q0)]

⇒ p01 × Q01 = ∑ p1q1∑p0q0

⇒ Factor reversal test is also satisfied

∴ Fisher’s ideal index number satisfied both time reversal and factor reversal test

Question 32

The value of simple correlation coefficient lies in the interval:

  1. AOption (a)

    [0, 1]

  2. BOption (b)

    [-1, 1]

  3. COption (c)

    [1, ∞]

  4. DOption (d)

    (-∞, -1)

View answer & explanation

Correct answer

Answer: (b)B.

[-1, 1]

Why this answer is correct

Explanation

The correlation Coefficient is a statistical measure of the strength of the relationship between the relative movements of two variables. The value range between -1 to 1

A calculated number greater than 1 or less than -1 means thta there was an error in the correlation measurement

Correlation 1 means a perfect positive correlation

Correlation -1 means a perfect negative correlation

0 correlation shows no linear relationship between the movement of the two variables

∴ The value of simple correlation coefficient in the interval of [-1, 1]

Question 33

A completely randomised design is based on the principles of ______ and randomisation only.

  1. AOption (a)

    divisibility

  2. BOption (b)

    compounding

  3. COption (c)

    local control

  4. DOption (d)

    replication

View answer & explanation

Correct answer

Answer: (d)D.

replication

Why this answer is correct

Explanation

The randomised design is based on the principle of replication

In the design of experiments, completely randomized designs are for studying the effects of one primary factor without the need to take another variable

into account.

In a completely randomized design, treatment levels or combinations are assigned to experimental units at random. This is typically done by listing the treatment

levels or treatment combinations and assigning a random number to each. By sorting on the random number, we produce a random order for the application of

the treatments to experimental units.

Question 34

The length of time X, needed by an examinee of competition to complete a 1-hour exam, is a random variable with

PDF f(x)=65(x2+x);0≤x≤1.f(x)=\dfrac{6}{5}(x^2+x);0 \le x \le 1., The value of F(0.5) is:

  1. AOption (a)

    45\frac{4}{5}

  2. BOption (b)

    25\frac{2}{5}

  3. COption (c)

    35\frac{3}{5}

  4. DOption (d)

    15\frac{1}{5}

View answer & explanation

Correct answer

Answer: (d)D.

15\frac{1}{5}

Why this answer is correct

Given

F(x) = 6/5(x2 + x); 0 ≤ x ≤ 1

Calculation

F(x) = \mathop \smallint \nolimits_0^x f\left( x \right)dx

⇒ \% MathType!MTEF!2!1!+- \% feaahqart1ev3aqatCvAUfeBSjuyZL2yd9gzLbvyNv2CaerbuLwBLn \% hiov2DGi1BTfMBaeXatLxBI9gBaerbd9wDYLwzYbItLDharqqtubsr \% 4rNCHbGeaGqiVu0Je9sqqrpepC0xbbL8F4rqqrFfpeea0xe9Lq-Jc9 \% vqaqpepm0xbba9pwe9Q8fs0-yqaqpepae9pg0FirpepeKkFr0xfr-x \% fr-xb9adbaqaaeGaciGaaiaabeqaamaabaabaaGcbaaeaaaaaaaaa8 \% qadaqfWaqabSWdaeaapeGaaGimaaWdaeaaieWapeGaa8hEaaqdpaqa \% a8qacqGHRiI8aaaaaa!3A60! \mathop \smallint \nolimits_0^x 6/5(x2 + x)dx

After integration we get,

⇒ 6/5(x3/3 + x2/2)

⇒ f(0.5) = (6/5)((0.5)3/3 - (0.5)2/2)

⇒ (6/5)(0.25/6 + 0.75/6)

⇒ (6/5)(1/6)

⇒ 1/5

∴ The value of F(0. 5) is:1/5

Question 35

If X follows a binomial distribution with n = 6 and p=14p=\dfrac{1}{4} then the skewness of X is:

  1. AOption (a)

    23\sqrt{\dfrac{2}{3}}

  2. BOption (b)

    23\dfrac{2}{\sqrt{3}}

  3. COption (c)

    23\dfrac{\sqrt{2}}{3}

  4. DOption (d)

    23\dfrac{{2}}{3}

View answer & explanation

Correct answer

Answer: (c)C.

23\dfrac{\sqrt{2}}{3}

Why this answer is correct

Given

n = 6

p = 1/4

Formula

Sk = (1 - 2p)/√(np(1 - p)

Calculation

Skewness of X = (1 - 2 × 1/4)/√(6 × 1/4(1 - 1/4)

⇒ (1 - 1/2(/√(3/2 × 3/4

⇒ 1/2/√(9/8)

∴ The value of skewness X is√2/3


Binomial distribution = A random variable X has a binomial distribution if its probability distribution is given by

b(x; n, p) = P(X = x) = (n x)pxqn - x x = 0, 1, 2, ----n

Normal distribution has the probability density function given by

f(x) = [1/(σ√2π)]e1/2(x - μ/σ)2

Here, μ and σ are prameters of this distribution. The parameter μ is mean and σ is square root of variance of this distribution

-∞ < μ < ∞, σ > 0

The normal distribution is also called as the Gaussian distribution

Question 36

The second degree parabola is form fitting to the time series when the variations are:

  1. AOption (a)

    Linear

  2. BOption (b)

    Nonlinear

  3. COption (c)

    Random

  4. DOption (d)

    Downward

View answer & explanation

Correct answer

Answer: (b)B.

Nonlinear

Why this answer is correct

Explanation

The second degree parabola = It describes the trend( non linear) in a time series where a change in the amount of change is constant per unit time.

The quadratic (parabolic)trend can be describe by equation

⇒ y = a + bx + cx2

The method of least square gives the normal equation as 

⇒ ∑y = na + b∑x + c∑x2

⇒ ∑xy = a∑x + b∑x2 + c∑x3

⇒ ∑x2y = a∑x2 + b∑x3 + c∑x4

However if ∑x = 0 then, the normal equation reduces to

⇒ ∑y = an + c∑x2

⇒ ∑xy = b∑x2

⇒ ∑x2y = a∑x2 + c∑x4

The values of a, b, and c can be found as

⇒ c = (n∑x2y - ∑x2)(∑y)/[n∑x2 - (∑x2)2]

⇒ a = (∑y - c∑x2)/n

⇒ b = ∑xy/∑x2

Question 37

Mutual and unique variances among multiple factors can be embodied in a diagram that comprises overlapping circles. The diagram is known as:

  1. AOption (a)

    ballantine diagram

  2. BOption (b)

    homogeneity diagram

  3. COption (c)

    path diagram

  4. DOption (d)

    3-way scatterplot

View answer & explanation

Correct answer

Answer: (a)A.

ballantine diagram

Why this answer is correct

Explanation

Ballantine venn diagram = Regression model can be visually reprersented with Ballantine Venn diagram. In these diagram, each variable in the regression model is repesented by a different circle.

∴  Mutual and unique variances among multiple factors can be embodied in a diagram that comprises overlapping circles. The diagram is known as BALLANTINE DIAGRAM


Homogeneity diagram = A graph is connected-homogeneous if every isomorphism between two connected induced subgraphs can be extended to an automorphism of the whole graph

Path diagram = In statistics, path analysis is used to describe the directed dependencies among a set of variables. This includes models equivalent to any form of multiple regression analysis, factor analysis, canonical correlation analysis, discriminant analysis, as well as more general families of models in the multivariate analysis of variance and covariance analyses.

3-way scatterplot = Unlike a classic XY scatter chart, a 3D scatter plot displays data points on three axes (x, y, and z) in order to show the relationship between three variables. Therefore, it is often called an XYZ plot. Regrettably, there is no way to create a 3D scatter plot in Excel, even in the new version of Excel 2019

Question 38

Calculate the coefficient of range for the following series:

Item10121416182022
Frequency5381234638
  1. AOption (a)

    0.17

  2. BOption (b)

    0.27

  3. COption (c)

    0.37

  4. DOption (d)

    0.47

View answer & explanation

Correct answer

Answer: (c)C.

0.37

Why this answer is correct

Given

Item10121416182022
Frequency5381234638

Formula

Coefficient of Range = S = (xm - xo)/(xm + xo)

Where, xm = Maximum value

xo = Minimum value

Calculation

Coefficient of range = (22 - 10)/(22 + 10)

⇒ Coefficient of range = 12/32

∴ Coefficient of range is 0.375

Question 39

The rankings of ten students in two subjects, Mathematics and Statistics, are as follows.

MathematicsStatistics
36
54
89
48
71
102
23
110
65
97

The coefficient of rank correlation is:

  1. AOption (a)

    -0.3

  2. BOption (b)

    0.3

  3. COption (c)

    0.1

  4. DOption (d)

    -0.1

View answer & explanation

Correct answer

Answer: (a)A.

-0.3

Why this answer is correct

Calculation

The coefficient of rank correlation = 1 – 6∑d2/n(n2 – 1)

D = r1 – r2

r1, r2 ------ are ranks

Mathematics (r1)Statistics (r2)d = Ir1 – r2Id2
3639
5411
8911
48416
71636
102884
2311
110981
6511
9724
Total10∑d2 = 214

According to spearman’s rank correlation coefficient ρ = 1 – 6∑d2/n(n2 – 1)

⇒ 1 – 6 × 214/10(100 – 1)

⇒ 1 – 6 × 214/990

⇒ 1 – 1.297

∴ The value of rank correlation is approx. – 0.3

Question 40

A fisheries researcher intends to test for a difference in mean weights of a single kind of fish collected by fishermen in three different lakes. Which option is correct for the null hypothesis?

  1. AOption (a)

    Not all fish populations have the same mean.

  2. BOption (b)

    μ1 = μ2 = μ3 = 0

  3. COption (c)

    μ1 = μ2 = μ3

  4. DOption (d)

    At least one of the fish populations has a different mean.

View answer & explanation

Correct answer

Answer: (c)C.

μ1 = μ2 = μ3

Why this answer is correct

Explanation

Null hypothesis = The null hypothesis is a typical statistical theory that suggests that no statistical relationship and significance exists in a set of given single observed variables, between two sets of observed data and measured phenomena.

∴ In this, the correct option for the null hypothesis is μ1 = μ2 = μ3

Question 41

The property that ‘on changing the unit of measurement of a commodity the index number does not change’ is called:

  1. AOption (a)

    test of equality

  2. BOption (b)

    test of homogeneity

  3. COption (c)

    test of commensurability

  4. DOption (d)

    test of proportionality

View answer & explanation

Correct answer

Answer: (c)C.

test of commensurability

Why this answer is correct

Explanation

The word commensurable means having a commonsurable that means test of commensurability is that probability after changing the unit of measurement of the commodity the index number does not change.

∴The property that ‘on changing the unit of measurement of a commodity the index number does not change’ is called the test of commensurability.

Test of equity = Test if two population means are equal. The two-sample t-test is used to determine if two population means are equal. A common application

is to test if a new process or treatment is superior to a current process or treatment.

Test of homogeneity = In the test of homogeneity, we select random samples from each subgroup or population separately and collect data on a single categorical variable. The null hypothesis says that the distribution of the categorical variable is the same for each subgroup or population. Both tests use the same chi-square test statistic.

The difference is a matter of design. In the test of independence, observational units are collected at random from a population and two categorical variables are observed for each unit. In the test of homogeneity, the data are collected by randomly sampling from each sub-group separately

test of proportionality = Let us consider the parameter p of population proportion. For instance, we might want to know the proportion of males within a total population of adults when we conduct a survey. A test of proportion will assess whether or not a sample from a population represents the true proportion from the entire population

Question 42

If the distribution is negatively skewed, then the:

  1. AOption (a)

    mean is more than the mode

  2. BOption (b)

    median is at right to the mode

  3. COption (c)

    mean is less than the mode

  4. DOption (d)

    mean is at right to the median

View answer & explanation

Correct answer

Answer: (c)C.

mean is less than the mode

Why this answer is correct

Explannation

For the positive skewed distribution the frequency curve has longer tail towards the right

Karl pearson’s measure of skewness is based upon the divergence of mean from mode in a skewed distribution

⇒ Sk = (Mean – Mode)/Standard deviation

The sign Sk gives the direction and its magnitude gives the extent of skewness

If Sk > 0 the distribution is positive skewed

If Sk < 0 the distribution is negative skewed

⇒ To obtained the  Sk < 0 we have one condition

∴ Mean will be less than the mode

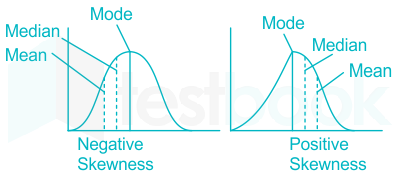
Relation of mean, mode, and median for positive skewness is Mean > Median > Mode

Relation of mean, mode, and median for negative skewness is Mode > Median > Mean

Question 43

Which statement of the following is incorrect?

  1. AOption (a)

    Secondary data is attained when statistical methods are applied to the primary data.

  2. BOption (b)

    Primary data collection requires less amount of resources such as time, cost and manpower.

  3. COption (c)

    Primary data is always precise to the researcher’s needs.

  4. DOption (d)

    Data poised through primary sources are more reliable.

View answer & explanation

Correct answer

Answer: (b)B.

Primary data collection requires less amount of resources such as time, cost and manpower.

Why this answer is correct

Explanation

Primary data collection is the process of gathering data through surveys, interviews, or experiments. A typical example of primary data is a household survey. In this form of data collection, researchers can personally ensure that primary data meets the standards of quality, availability, statistical power, and sampling required for a particular research question.

∴ Primary data collection requires less amount of resources such as time, cost and manpower.

Secondary data collection = Secondary data refers to data that is collected by someone other than the primary user. Common sources of secondary data for social science include censuses, information collected by government departments, organizational records and data that was originally collected for other research purposes

Question 44

Which of the following is a cross-sectional data?

  1. AOption (a)

    Share price of 5 companies on a particular day

  2. BOption (b)

    Deposits of a bank over a period of time

  3. COption (c)

    Number of cars exported from India in the last 4 years

  4. DOption (d)

    Net profit of a company in the last 3 years

View answer & explanation

Correct answer

Answer: (a)A.

Share price of 5 companies on a particular day

Why this answer is correct

Explanation

Cross - sectional data are the result of a data collections, carried out at a single point in time on a statistical unit. With cross - sectional data, we are not interested in the change of data over time, but in the current, valid opinion of the respondents about a question in a survey.

∴ The share price of 5 companies on a particular day is a cross - sectional data.

Question 45

There were 25 employees in an office. The mean salary of the employees was Rs. 30,000 per month. A senior officer having a salary of Rs. 60,000 per month retired, and a new clerk was appointed in his place. The mean salary of the employees in the office was thus reduced by Rs. 1,000 per month. The salary of the new clerk (per month) was:

  1. AOption (a)

    Rs. 30,000

  2. BOption (b)

    Rs. 25,000

  3. COption (c)

    Rs. 35,000

  4. DOption (d)

    Rs. 40,000

View answer & explanation

Correct answer

Answer: (c)C.

Rs. 35,000

Why this answer is correct

Given

Total employ in the office = 25

Mean salary of the employees = Rs 30,000/ month

An senior officer retired whose salary = 60,000/month

After adding new clerk the mean salary of the employees reduced by 1,000 per month.

Formula

Mean = Sum of the all observations/number of observations

Calculation

The mean salary of 25 employees = 30,000

⇒ The sum of the salary of all employees = 30000 × 25

⇒ 750,000

After retiring the senior officer of monthly salary 60,000

⇒ New sum of salary = 750,000 – 60,000

⇒ 690,000

After adding new member the average salary salary was reduced by 1000

⇒ New average salary = 29,000

⇒ New sum of salary of 25 employees = 29000 × 25

⇒ 725,000

The salary of new employees per month = 725,000 – 690,000

⇒ The salary of new employees be Rs 35,000 per month

Question 46

If the customers arrive in a shop in Poisson fashion with parameter λ, the fourth raw moment μ4′\mu_4^{'} for the inter-arrival time is:

  1. AOption (a)

    1λ4\dfrac{1}{\lambda^4}

  2. BOption (b)

    4λ4\dfrac{4}{\lambda^4}

  3. COption (c)

    6λ4\dfrac{6}{\lambda^4}

  4. DOption (d)

    24λ4\dfrac{24}{\lambda^4}

View answer & explanation

Correct answer

Answer: (d)D.

24λ4\dfrac{24}{\lambda^4}

Why this answer is correct

Formula

For the exponential distribution rth raw moment is given by

μr­’ = dr/dtr(λ/(λ – t)

Calculation

For the 4th raw moment μr’ is given by

⇒ (d4/dt4)(λ/(λ – t)

After differentiate it 4 times we get the value

⇒ 24λ /(λ  - t)5

When t = 0

∴ The value of μr’ = 24/λ4

Question 47

The additive model of the time series is:

  1. AOption (a)

    Y = a + bX

  2. BOption (b)

    Y = TSCI

  3. COption (c)

    Y = a + bX + cX2

  4. DOption (d)

    Y = T + S + C + I

View answer & explanation

Correct answer

Answer: (d)D.

Y = T + S + C + I

Why this answer is correct

Explanation

Additive model assumes  that the observed value is obtained by adding the Trend(T) by the rates of three other components

Y = T + S + C + I

where as

Y = Original data

T = Trend

S = Seasonal variation

C = Cyclical variation

I = Irregular movement


Explanation

Multiplicative model assumes  that the observed value is obtained by multiplying the Trend(T) by the rates of three other components

Y = T × S × C × I

where as

Y = Original data

T = Trend

S = Seasonal variation

C = Cyclical variation

I = Irregular movement

Question 48

If, in a series, there are m items whose ranks are common, then which factor is added for correction for each repeating value in both series?

  1. AOption (a)

    112m\dfrac{1}{12}m

  2. BOption (b)

    112m(m−1)(m+1)\dfrac{1}{12}m(m-1)(m+1)

  3. COption (c)

    112(m−1)(m+1)\dfrac{1}{12}(m-1)(m+1)

  4. DOption (d)

    112m(m−1)\dfrac{1}{12}m(m-1)

View answer & explanation

Correct answer

Answer: (b)B.

112m(m−1)(m+1)\dfrac{1}{12}m(m-1)(m+1)

Why this answer is correct

Explanation

According to  Spearman's rank correlation coefficient when ranks are repeated is as follows - 

⇒ rs = 1 - 6[(∑d2 + (m13 - m1)/12 + (m23 - m2)/12 + -------)]/n(n2 - 1)

m1, m2 ----- are the number of repetitions of the ranks

(m13 - m1)/12 ----- are corresponding factors

∴ The factor is added for each repeating value in the both series is given by (m3 - m)/12 = m(m2 - 1)/12 = m(m - 1)(m + 1)/12

Originally the spearsman rank correlation is denotted by rs = 1-6∑d2/n(n2 - 1)

Question 49

A discrete random variable X has the probability functions as:

X012345678
f(x)K2k3k5k5k4k3k2kk

The value of E(X) is:

  1. AOption (a)

    97/26

  2. BOption (b)

    107/26

  3. COption (c)

    93/26

  4. DOption (d)

    103/26

View answer & explanation

Correct answer

Answer: (d)D.

103/26

Why this answer is correct

Explanation:

xF(x)xf(x)
0k0
12k2k
23k6k
35k15k
45k20k
54k20k
63k18k
72k14k
8k8k
Total26k103k


We know that for Fpr random variable X sum of Probaboility = 1

⇒ ∑Pi = 1

⇒ k + 2k + 3k + 5k + 5k + 4k + 3k + 2k + k = 1

⇒ 26k = 1

⇒ k = 1/26

∴ xf(x) = 103k = 103 × 1/26

∴ E(x) is 103/26

Question 50

If Z~ Φ (0, 1) is a standard normal variate, then Z2 follows:

  1. AOption (a)

    log-normal distribution with μ = 0 and σ = 1

  2. BOption (b)

    chi-squared distribution with degree of freedom 1

  3. COption (c)

    standard normal distribution with μ = 0 and σ = 1

  4. DOption (d)

    bi-standard normal distribution with μ = 0 and σ = 1

View answer & explanation

Correct answer

Answer: (b)B.

chi-squared distribution with degree of freedom 1

Why this answer is correct

Explanation

If Z~ Φ (0, 1) it means Z - standard normal distribution with mean (μ) = 0 and standard deviation (σ) = 1 

The Standard Normal Distribution:

  • The standard normal distribution is centered at zero and the degree to which a given measurement deviates from the mean is given by standard deviation.

सामान्य वितरण के लक्षण

Chi-square Distribution:

The sum of Standard Normal Distribution is the chi-square distribution with degrees of freedom equal to the number of standard normal variate are used in the summation.

If Suppose If X follows Normal Distribution, then

X∼N(μ,σ2)

It can be converted into standard normal distribution using the following transformation 

X - μ ∼ N(0, σ2)

X−μσ2∼(0,1)\frac{X-\mu}{\sigma^2}\sim(0, 1)

If we square the standard normal we get the Chi-square Distribution with 1 degree of freedom.

and ∑i=1n(X−μσ2)2∼χn2\displaystyle\sum^n_{i = 1}{\left(\frac{X-\mu}{\sigma^2}\right)^2} \sim\chi^2_n  follows the chi-square distribution at n degrees of freedom.

Question 51

Which option is correct for the correlation ratio E2 ?

  1. AOption (a)

    E takes the values between -1 and 1

  2. BOption (b)

    E takes the values between 0 and ∞

  3. COption (c)

    E takes the values between -∞ and ∞

  4. DOption (d)

    E takes the values between 0 and 1

View answer & explanation

Correct answer

Answer: (d)D.

E takes the values between 0 and 1

Why this answer is correct

Explanation

Let each observation be yxi

Where x indicates the category that observation is in and

i is the label of the particular observation.

nx = The number of observation in category x

⇒ y̅x= ∑iyxi/nx

⇒ y̅ = ∑xnxy̅x/∑xnx

y̅x = Mean of category x

y̅ = mean of the whole population

The correlation ratio E2 = ∑xnx(y̅x – y̅)2/∑xi(yxi – y̅)2

⇒ E2 = σ2y̅ /σ2y

Where as, σ2y̅  = ∑xnx(y̅x – y̅)2/∑xnx

σ2y = ∑x,i(yxi – y̅)2/n

The weighted variance of the category means divided by the variance of all samples.It is the relation between values of x and values of y̅x is linear this will give the same result as the square of pearson’s correlation coefficient; otherwise the correlation ratio will be larger in magnitude. It can therefore be used for judging non linear relationship

∴ E takes the values between 0 and 1

Important Points

The E = 0  represents the special case of no dispersion among the mean of the different categories

E = 1 refers to no dispersion within the respective categories

E2 = 0 to 1, we have to learn this result

The value of correlation coefficient = - 1 to 1

Question 52

The first four moments about the mean of distribution are 0, μ2, 0.7 and 18.75. If the distribution is mesokurtic, the value of μ2, is

  1. AOption (a)

    2.5

  2. BOption (b)

    3.5

  3. COption (c)

    0.5

  4. DOption (d)

    1.5

View answer & explanation

Correct answer

Answer: (a)A.

2.5

Why this answer is correct

Given

μ1 = 0

μ3 = 0.7

μ4 = 18.75

β2 = 3 ( distribution is mesokurtic)

Formula

β2 = (μ4)/(μ2)2

μ2 and μ4 are moments about the mean

β2 = Coefficient of kurtosis

Calculation

According to formula

⇒ 3 = 18.75/(μ2)2

⇒ μ22 = 18.75/3

⇒ 6.25

∴ The value of μ2 = 2.5

Question 53

Which of the following statements is correct ?

  1. AOption (a)

    The sum of squares between classes is not independent of the change of origin

  2. BOption (b)

    The sum of squares within classes is not independent of the change of origin

  3. COption (c)

    All the sum of squares are independent of the change of origin

  4. DOption (d)

    The total sum of squares is not independent of the change of origin

View answer & explanation

Correct answer

Answer: (c)C.

All the sum of squares are independent of the change of origin

Why this answer is correct

Explanation

In an analysis of variance, all the sum of squares are independent of the change of origin

One way analysis of variance or one way classification table is as follows

Source of variationSum of squaresDegree of freedomMean squares
Between samples within samplesSSC SSEK – 1 N – KMSC MSE
TotalSSTN - 1

SST = Total sum of the square

SST = Sum of the square of the column

SSE = Sum of the square of the Error

MSC = Variance between samples

MSE = Variance within the samples

Question 54

The mean deviation from the average A is minimum if A represents

  1. AOption (a)

    harmonic mean

  2. BOption (b)

    arithmetic mean

  3. COption (c)

    mode

  4. DOption (d)

    median

View answer & explanation

Correct answer

Answer: (d)D.

median

Why this answer is correct

Explanation

The mean deviation from the median calculates the arithmetic average of the deviations of the observed values from median of the observed values.

The mean deviation is minimum when the deviation is taken from median as the median is the middlemost value of the series and disperse the whole series into minimal value

∴ The mean deviation from the average A is minimum if A represents Median


Mean deviation = 1/n(∑x - M)

M = Median or mean 

x = values of the observations

Coefficient of mean deviation = Mean deviation/(Mean or median or mode)

The mean deviation about median is minimum

The absolute mean deviation about the mean is independent of change of origin.

Question 55

The graphical representation of the time series is known as:

  1. AOption (a)

    histogram

  2. BOption (b)

    ogive

  3. COption (c)

    straight line

  4. DOption (d)

    historigram

View answer & explanation

Correct answer

Answer: (d)D.

historigram

Why this answer is correct

Explanation

Ogive = When X – coordinates are the upper limits of the class interval and y coordinates are corresponding cumulative frequency on a curve by joining points is called ogivi curve

Histogram = A histogram is a graphical display of data using bars of different heights. In a histogram, each bar groups numbers into ranges.In Histogram we can represent time series.

Straight-line = If an equation can be rearranged into the form y = m x + c , then its graph will be a straight line

Historigram = A historigram is a graphical representation of a time series that reveals the changes that occurred at different time periods

∴ Historigram is the correct option

Question 56

What percentage of scores falls within three standard deviations from the mean for the normal variate?

  1. AOption (a)

    95%

  2. BOption (b)

    99.7%

  3. COption (c)

    67.8%

  4. DOption (d)

    50%

View answer & explanation

Correct answer

Answer: (b)B.

99.7%

Why this answer is correct

Explanation

The approx. percentage is 95% of the data fall within two standard deviation of the mean

Now the approx. 99,7% of the data  fall within three standard deviation of the mean

Question 57

If X is a Poisson variate with P(X = 0) = 0.6, then the variance of X is:

  1. AOption (a)

    ln(53)\rm{ln} \left( \dfrac{5}{3} \right)

  2. BOption (b)

    log1015

  3. COption (c)

    0

  4. DOption (d)

    ln 15

View answer & explanation

Correct answer

Answer: (a)A.

ln(53)\rm{ln} \left( \dfrac{5}{3} \right)

Why this answer is correct

Given

In Poisson distribution

P(X = 0) = 0.6

Formula

Poisson distribution is given by

f(x) = e-λλx/x!

Calculation

P(X = 0) = e-λλ0/0!

⇒ 0.6 = e-λ

⇒ 1/eλ = 6/10 = 3/5

⇒ eλ = 5/3

Taking log on both side

⇒ logeeλ = loge(5/3)

∴ λ = Loge(5/3)

Question 58

Study the following production data of a sugar factory.

Year2001200220032004200520062007
Production (‘000 tonnes) (y)76879581919690


What is the estimate of the production for 2008 using straight-line trend - with the origin at the year 2001 - by the least-squares method (∑x=0,∑x2=28,∑xy=56)?(\sum x= 0, \sum x^2 = 28, \sum xy = 56) ?

  1. AOption (a)

    86

  2. BOption (b)

    88

  3. COption (c)

    102

  4. DOption (d)

    98

View answer & explanation

Correct answer

Answer: (c)C.

102

Why this answer is correct

Given

∑x = 0

∑x2 = 28

∑xy = 56

Formula

a = ∑y/n

b = ∑xy/∑x2

Explanation

Yeary
200176
200287
200395
200481
200591
200696
200790
N = 7∑y = 616

Y = a + bx

⇒ a = 616/7

⇒ a = 88

⇒ b = 56/28

⇒ b = 2

Y = 88 + 2x

⇒ X = 2008 – 2001 = 7

Y = 88 + 2 × 7

∴ estimate of the production for 2008 is 102

Question 59

For the random variable X having PDF f(x) = 4x3; 0 < x < 1, the interquartile range is:

  1. AOption (a)

    (34)14−(14)14\left( \dfrac{3}{4} \right)^{\dfrac{1}{4}} - \left( \dfrac{1}{4} \right)^{\dfrac{1}{4}}

  2. BOption (b)

    (34−14)4\left( \dfrac{3}{4} - \dfrac{1}{4} \right)^4

  3. COption (c)

    (34−14)14\left( \dfrac{3}{4} - \dfrac{1}{4} \right)^\dfrac{1}{4}

  4. DOption (d)

    (14)14−(34)14\left( \dfrac{1}{4} \right)^\dfrac{1}{4} - \left( \dfrac{3}{4} \right)^\dfrac{1}{4}

View answer & explanation

Correct answer

Answer: (a)A.

(34)14−(14)14\left( \dfrac{3}{4} \right)^{\dfrac{1}{4}} - \left( \dfrac{1}{4} \right)^{\dfrac{1}{4}}

Why this answer is correct

Given

F(x) = 4x3

Formula

For interquartile range = Q3 – Q1

Q3 = 75/100

Q1 = 25/100

Calculation

**\mathop \smallint \nolimits_o^{Q3} **4x3dx = 75/100

⇒ ¾ = 4 (X4/4)Q30

⇒ ¾ = (Q43 – 0))

⇒ ¾ = Q43

∴ Q3 = (3/4)1/4

For Quartile (Q1),

⇒ 25/100 = \mathop \smallint \nolimits_o^{Q1} 4x3dx

⇒ ¼ = 4(x4/4)Q10

⇒ ¼ = (Q14 – 0)

⇒ ¼ = Q14

∴ Q1 = (1/4)1/4

∴ Interquartile range Q3 – Q1 IS (3/4)1/4  - (1/4)1/4

Question 60

If xi | fi, i = 1, 2,...n is a frequency distribution with variance 2, mode 24 and arithmetic mean 25, then the mean square deviation from the mode is:

  1. AOption (a)

    3

  2. BOption (b)

    1

  3. COption (c)

    4

  4. DOption (d)

    2

View answer & explanation

Correct answer

Answer: (a)A.

3

Why this answer is correct

Given

Variance = 2

Mode = 24

Arithmetic mean = 25

Formula

Var(X) = (1/n)∑(xi - x̅)2

Calculation

Var(X) =  (1/n)∑(xi - x̅)2

⇒ 2 = (1/n)∑(xi - 25)2

⇒ 2n = ∑xi2 + 625n - 50∑xi

⇒ 2n = ∑xi2 + 625n - 50(∑xi/n) × n

⇒ 2n = ∑xi2 + 625n - 50n × 25       {∑xi/n = mean = 25}

⇒ 2n = ∑xi2 - 625n

⇒ ∑xi2 = 627n

Mean square deviation = MSD = (1/n)∑(xi - Z)2  here Z = Mode

⇒ MSD = (1/n)∑(xi - 24)2

⇒ (1/n)∑(xi2 + 576n - 48xi)

⇒ (1/n)∑xi + 576n - 48 (∑xi/n) × n)

⇒ (1/n)(627n + 576 - 48 × 25)

⇒ (1/n)( 627n - 624n)

⇒ (1/n)(3n)

∴ The value of mean square deviation from mode is 3

Question 61

If Mean > Median > Mode, the distribution is:

  1. AOption (a)

    left-skewed

  2. BOption (b)

    negative-skewed

  3. COption (c)

    normal

  4. DOption (d)

    right-skewed

View answer & explanation

Correct answer

Answer: (d)D.

right-skewed

Why this answer is correct

Calculaton

For the positive skewed or right skkewed distribution the frequency curve has longer tail towards the right

Karl pearson’s measure of skewness is based upon the divergence of mean from mode in a skewed distribution

⇒ Sk = (Mean – Mode)/Standard deviation

The sign Sk gives the direction and its magnitude gives the extent of skewness

If Sk > 0 the distribution is positive skewed or right skewed

If Sk < 0 the distribution is negative skewed

⇒ To obtained the  Sk > 0 we have one condition

∴  Mean > Median > Mode

Question 62

For a group of 5 male residents in a society, the mean and standard deviation of their ages are 63 years and 9 years, respectively. For a group of 4 female residents, these values are 54 years and 6 years, respectively. The variance of the combined group of male and female residents is:

  1. AOption (a)

    3

  2. BOption (b)

    81

  3. COption (c)

    27

  4. DOption (d)

    9

View answer & explanation

Correct answer

Answer: (b)B.

81

Why this answer is correct

Given

Two series of data are given

N1  = 5 and N2 = 54

x̅1 = 63 and x̅2 = 4

σ1 = 9 and σ2 = 6

X̅ = (N1x̅1 + N2x̅ 2)/(N1 + N2)

X̅ = Combined mean of both group

x̅1 and x̅2 are mean of two series

N1 and N2 are group of male and female

σ1 and σ2 are the standard deviation

Formula

Variance of (X1 + X2) = [N1(σ21 + D21) + N2(σ21 + D22)]/(N1 + N2)

D1 = x̅1 – X̅

D2 = x̅2 – X̅

Calculation

Combined mean = (N1x̅1 + N2x̅ 2)/(N1 + N2)

⇒ X̅ = (5 × 63 + 4 × 54)/(5 + 4)

⇒ X̅ = 531/9

∴ Combined mean = 59

⇒ D1 = 63 – 59 = 4

⇒ D2 = 54 – 59 = -5

⇒ Var(male and female combined) = [5(92 + 42) + 4(62 + (-5)2]/(5 + 4)

⇒ 729/9

∴ The combined variance is 81


We define variance as the square of the standard deviation  and it is denoted by σ2

Basically the mathematical formula of Combined variance is given by

Combined Variance = [N1(σ21 + D21) + N2(σ21 + D22)]/(N1 + N2)

N1 and N2 are No of observations in series 1 and 2

σ12 and σ22 are variance of  first series and second series

d1 and d2 are combined mean  - mean of first and second series

Question 63

A sample of 30 latest returns on UTI stock reveals a mean return of 4withasamplestandarddeviationof4 with a sample standard deviation of 0.13. The estimated standard error of the sample mean is:

  1. AOption (a)

    0.550.55

  2. BOption (b)

    0.020.02

  3. COption (c)

    0.340.34

  4. DOption (d)

    0.220.22

View answer & explanation

Correct answer

Answer: (b)B.

0.020.02

Why this answer is correct

Given

n = sample size = 30

σ = standard deviation = 0.13

Formula

The standard error of the sample mean = σ/√n

Calculation

Standard error of the sample mean = 0.13/√30

∴ The standard error of sample mean is 0.02


The mean of the sampling distribution of means μX̅  = μ

The variance of sampling with replacement σX̅2 = σ2/n

The standard deviation of mean with rreplacement = σ/√n or S/√n

Question 64

For the discrete random variable X having probability mass function (1 - p)k - 1p; k = 1, 2, 3,...; 0 < p ≤ 1, the mode of X is

  1. AOption (a)

    1

  2. BOption (b)

    0

  3. COption (c)

    p 

  4. DOption (d)

    1 - p

View answer & explanation

Correct answer

Answer: (a)A.

1

Why this answer is correct

Given

PMF = (1 - p)k - 1p

Concept used 

Mode is the value of x for which f(x) is the maximum. IIt can be obtained by equating the first derivative of f(x) to zero and checking that the second derivative of f(x)  is negative I;e

F’(x) = 0 and f’’(x) < o

Calculation

This PMF is in geometric expression and the mode of geometric distribution is 1

∴ Mode of X is 1

Question 65

The data relating to the donation, in hundreds, for welfare in the village of 543 members is follows.

Amount20304050607080
No. of members:361132153140513


The decile D6 for this data is:

  1. AOption (a)

    45

  2. BOption (b)

    50

  3. COption (c)

    55

  4. DOption (d)

    40

View answer & explanation

Correct answer

Answer: (b)B.

50

Why this answer is correct

Formula

Di = iN/10

N = Total frequency

I = Quartile number

Calculation

Amount (x)No. of memberscf
2033
306164
40132196
50153349
60140489
7051540
803543

Decile = iN/10

⇒ d6 = 6 × 543/10

⇒ d6 = 6 × 54.3

⇒ d6 = 325.8

∴ 325.8 lies in range of 50

∴ 6th decile is 50

Question 66

For grouped data, the expression of the median is based on:

  1. AOption (a)

    interpolation method

  2. BOption (b)

    extrapolation method

  3. COption (c)

    trial and error method

  4. DOption (d)

    iterative method

View answer & explanation

Correct answer

Answer: (a)A.

interpolation method

Why this answer is correct

Explanation

For the grouped data the formula of the median is given by

Median = L1 + I/F(N/2 - c)

Whereas, L1 = Lower limit of the class in which particular partition values lies

F = Frequency of the class interval

N = Total frequency

c = Cumulative frequency of the class preceding the class in which the particular partition value lies

I= Width of the class interval

This method is called the Interpolation method

∴ For grouped data, the expression of the median is based on the interpolation method

Question 67

The following measures were computed for a moderately symmetrical frequency distribution: mean = 50, coefficient of variation = 35% and Karl Pearson's Coefficient of Skewness = - 0.25. The value of the median of the distribution is:

  1. AOption (a)

    4358\dfrac{435}{8}

  2. BOption (b)

    83524\dfrac{835}{24}

  3. COption (c)

    123524\dfrac{1235}{24}

  4. DOption (d)

    83516\dfrac{835}{16}

View answer & explanation

Correct answer

Answer: (c)C.

123524\dfrac{1235}{24}

Why this answer is correct

Given

Mean = X̅ = 50

Coefficient of variation = CV = 35%

Coefficient of skewness = SKp = -0.25

Formula

CV = (σ/X̅) × 100

SKp = (Mean – Mode)/σ

Mode = 3 × Median – 2 × Mean

σ = Standard deviation

Calculation

CV = (σ/x̅) × 100

⇒ 35 = (σ/50) × 100

∴ σ = 35/2 = 17.5

Coefficient of skewness = (Mean – Mode)/σ

⇒ - 0.25 = (50 – Mode)/17.5

⇒ (50 – Mode) = 0.25 × 17.5

∴ Mode = 50 + 4.375 = 54.375

Mode = 3 × Median – 2 × Mean

⇒ 54.375 = 3 × Median – 2 × 50

⇒ 3 × Median = 100 + 54.375

⇒ Median = 154.375/3 = 51.458

∴ The value of median is 51458/1000 = 1235/24

Question 68

A pollution check department intends to determine whether the mean pollutant count per unit volume of water at a lake is within the safety level of 200. A researcher collected ten water samples of unit volume and found the pollutant count to be:175, 190, 215, 198, 184, 207, 210, 193, 196, 180. You may undertake that the measurements constitute a sample from a normal population. The critical region to test at the a = .01 level so that the pollutant count within the safety level

is:

  1. AOption (a)

    T ≤ -t9,0.01

  2. BOption (b)

    Z ≤ -Z0.2

  3. COption (c)

    Z ≤ -Z0.01

  4. DOption (d)

    T ≤ -t10,0.01

View answer & explanation

Correct answer

Answer: (a)A.

T ≤ -t9,0.01

Why this answer is correct

Explanation

HO : μ < μo

T = ( X̅ - μ)/s/√n

T ≤ tα,n - 1

⇒ α = 0.01

n = 10

⇒ t0.01, 10 - 1

∴ the pollutant count within the safety level is: t0.01,9

Question 69

Factory A and Factory B employ 476 and 524 employees. respectively. The average weekly salary of an employee in Factory A is 34.5whereasforanemployeeinFactoryBitis34.5 whereas for an employee in Factory B it is 28.5, The standard deviation in paying the individual salary has been recorded as 5and5 and 4.5 for Factory A and Factory B, respectively. Which factory has greater variability in paying individual salary?

  1. AOption (a)

    Data insufficient to answer question

  2. BOption (b)

    Both have the same variability

  3. COption (c)

    A

  4. DOption (d)

    B

View answer & explanation

Correct answer

Answer: (d)D.

B

Why this answer is correct

Given

Average weekly wages of factory A = 34.5

Average weekly wages of factory B = 28.5

Number of employees engaged in factory A = 476

Standard deviation (σ)A = $5

Standard deviation (σ)B = $4.5

Formula

For answering the question we have to find out the coefficient of variation

Coefficient of variation =( S.D. x 100 )/average wages

Calculation

coefficient of variation for factory A

⇒ ( 5.0 x 100 ) /34.5

⇒ 14.49

Coefficient of variation for factory B

⇒ ( 4.5 x 100 ) / 28.5

⇒ 15.78

Higher the coefficient of variation, the higher the variability of individual wages.

∴ Factory B is having higher variability in individual wages.


Standard deviation = Standard deviation is the square root of the mean of square of deviation from the arithmetic mean. The standard deviation is denoted by σ

σ = √[(1/n)∑(xi – x̅)2]

If we square the standard devation we will get variance, therefore

Variance = σ2 = [(1/n)∑(xi – x̅)2]

For example

The standard deviation of 5, 10, 20 and 25 is

 Mean = (5 + 10 + 20 + 25)/4 = 15

SD = σ = √[(1/4)(5 – 15)2 + (10 – 15)2 + (20 – 15)2 + (25 – 15)2]

σ = √[(1/4)(100 + 25 + 25 + 100)]

σ = √[(1/4)(250

σ = √125/2

Variance = σ2 = 125/2

Coefficient of variation =  (Standard deviation/mean) × 100

(σ/x̅)× 100

Question 70

Calculate the mode of the following frequency distribution

Seconds51-5556-6061-6566-70
Frequency2784
  1. AOption (a)

    61.5

  2. BOption (b)

    62.5

  3. COption (c)

    64.5

  4. DOption (d)

    63.5

View answer & explanation

Correct answer

Answer: (a)A.

61.5

Why this answer is correct

Explanation:

Given, 

SecondsFrequency
51 – 552
56  - 607
61 – 658
66 - 704

The interval is not continuous, therefore subtract 0.5 from the lower limit and add 0.5 in the upper limit.

Now, the table will be

SecondsFrequency
50.5 – 55.52
55.5  - 60.57
60.5 – 65.58
65.5 - 70.54

The interval with the highest frequency is 60.5 - 65.5.

Modal class = 60.5 – 65.5 ( Highest frequency = 8)

Formula

Mode = L + [f1−f02f1−f0−f2]\big[\frac{f_1-f_0}{2f_1-f_0-f_2}\big] × I

I = class interval or class size = 5

f1 = frequency of modal class = 8

f0 = frequency of class preceding modal class = 7

f2 = frequency of class succeeding modal class = 4

L = lower limit of modal class = 60.5

Mode = 60.5 +  [8−72×8−7−4]\big[\frac{8-7}{2\times 8-7-4}\big] × 5

= 60.5 + [116−11\frac{1}{16-11}] × 5

= 60.5 + 15\frac{1}{5}× 5

= 60.5 + 1

∴ The mode is 61.5.

The correct answer is option (1).

Question 71

If there are r rows and s columns in a two-way analysis of variance, then the number of degrees of freedom between the rows is:

  1. AOption (a)

    (r - 1)

  2. BOption (b)

    r 

  3. COption (c)

    (s - 1)

  4. DOption (d)

    s

View answer & explanation

Correct answer

Answer: (a)A.

(r - 1)

Why this answer is correct

Explanation

The degree of freedom for the systematic difference among rows equal number of rows – 1,

∴  The degree of freedom is r - 1

Question 72

If a constant 60 is subtracted from each of the values of X and Y, then the regression coefficient is

  1. AOption (a)

    reduced by 60

  2. BOption (b)

    increased by 60

  3. COption (c)

    160th\dfrac{1}{60}^{th}of the original regression coefficient

  4. DOption (d)

    not changed

View answer & explanation

Correct answer

Answer: (d)D.

not changed

Why this answer is correct

Explanation

The regression coefficient are independent of the change of the origin. But , they are not independent of the change of the scale. It means there will be no effect on the regression coefficient if any constant is subtracted from the values of x and y

∴ After subtracting constant 60 from each value of X and Y, the regression coefficient is not changed

Question 73

Given that P(A) = 1/5, P(B) = 1/4, P(A | B) = 1/4, the value of P (B | A) is:

  1. AOption (a)

    116\dfrac{1}{16}

  2. BOption (b)

    1116\dfrac{11}{16}

  3. COption (c)

    15\dfrac{1}{5}

  4. DOption (d)

    516\dfrac{5}{16}

View answer & explanation

Correct answer

Answer: (d)D.

516\dfrac{5}{16}

Why this answer is correct

Given

P(A) = 1/5

P(B) = 1/4

P(A/B) = 1/4

Formula

P(A/B) = P(A ∩ B)/P(B)

P(B/A) = P(B ∩ A)/P(A)

Calculation

According to questions

1/4 = P(A ∩ B)/1/4

⇒ P(A ∩ B) = 1/4 × 1/4

⇒ P(A ∩ B) = 1/16

P(B/A) = P(B ∩ A)/1/5

⇒ P(B/A) = 1/16/1/5

⇒ P(B/A) = 5/16

∴ The value ofP(B/A) is 5/16

Question 74

If random variable X is binomially distributed with parameters n = 5, p = 0.4, the third factorial moment of Y equals

  1. AOption (a)

    0.384

  2. BOption (b)

    3.84

  3. COption (c)

    0.768

  4. DOption (d)

    7.68

View answer & explanation

Correct answer

Answer: (b)B.

3.84

Why this answer is correct

Formula

The probability distribution function o Binomial distribution is give asfollows

F(x) = ncxpxqn – x

The factorial moment = ncrpr!r

X = 0, 1, 2 ---n

p = Probability of success event

q = 1 – p = Probability of failure of event.

Calculation

According to the formula of factorial moment of binomial distribution

⇒ E[(X)r] =  5c3(0.4)3!3

⇒ [5!/(3!(5 – 3)!](0.4 × 0.4 × 0.4)!3

⇒ [5!/3! × 2!](0.064(3)

∴ The value of E[(X)r] is 3.84

Question 75

If the quartile range is 36, then the quartile deviation is:

  1. AOption (a)

    72

  2. BOption (b)

    9

  3. COption (c)

    36

  4. DOption (d)

    18

View answer & explanation

Correct answer

Answer: (d)D.

18

Why this answer is correct

Given

Quartile range = 36

Formula

Quartile range = (Q3 – Q1)

Quartile deviation = 1/2(Q3 – Q1)

Q3 and Q1 are third and first quartile

Calculation

Quartile range = (Q3 – Q1)

⇒ (Q3 – Q1) = 36

⇒ Quartile deviation = 36/2

∴ The value of quartile deviation is 18


If the quartile range is given in question then, the result of quartile deviation is 1/2 of the quartile range

Question 76

If a random variable X has the PDF f(x) = 1/2; -1 < x < 1, then the PDF of Y = X2 is:

  1. AOption (a)

    1y;−1≤y≤1\dfrac{1}{\sqrt y}; -1 \le y \le 1

  2. BOption (b)

    1y;0≤y≤1\dfrac{1}{\sqrt y}; 0 \le y \le 1

  3. COption (c)

    12y;−1≤y≤1\dfrac{1}{2\sqrt y}; -1 \le y \le 1

  4. DOption (d)

    12y;0≤y≤1\dfrac{1}{2\sqrt y}; 0 \le y \le 1

View answer & explanation

Correct answer

Answer: (d)D.

12y;0≤y≤1\dfrac{1}{2\sqrt y}; 0 \le y \le 1

Why this answer is correct

Explanation

FY(y) = P(Y ≤  y)

⇒ P(X2 ≤ y)

⇒ P(X ≤ √y)

⇒ FX(√y) = ∫o−;√y\smallint \nolimits_o^{ - ;\surd y}1/2dy

⇒ ½(y)o-√ y

⇒ ½(1/√y

∴ The PDF of Y = X2 IS (1/2√y)

Question 77

A random variable X is binomially distributed with parameter n = 25 and p = 0.2. The skewness of the variable X is

  1. AOption (a)

    0.40

  2. BOption (b)

    0.35

  3. COption (c)

    0.25

  4. DOption (d)

    0.30

View answer & explanation

Correct answer

Answer: (d)D.

0.30

Why this answer is correct

Given

n = 25

p = 0.2

q = 1 – p = 0.8

Formula

The skewness of binomial distribution is β1

β1 = (q – p)/√(n × p × q)

p = probability of success event

q = probability of failure event

Calculation

β1 = (0.8 – 0.2)/√(25 × 0.8 × 0.2)

⇒ 0.6/√(40

∴ The skewness of variable X is 0.3

Question 78

Let X be a continuous random variable having PDF f(x) = 1/8; -3 < x < 5. The median of the distribution of X is:

  1. AOption (a)

    1

  2. BOption (b)

    6412\sqrt { \dfrac{64}{12}}

  3. COption (c)

    0

  4. DOption (d)

    6412 \dfrac{64}{12}

View answer & explanation

Correct answer

Answer: (a)A.

1

Why this answer is correct

Concept used

For median ∫f(x)dx;\smallint f\left( x \right)dx; =  50/100 or ½

Limits are from – 3 to 5

⇒ ∫f(x)dx=\smallint f\left( x \right)dx = (\mathop \smallint \nolimits_{ - 3}^5 \frac{1}{8}dx \)

⇒ (1/8)(x)5-3

⇒ 1/8[5 – (- 3)]

∴ The median of the distribution X is 1

Question 79

The index that indicates the progress or recession of an economic cycle in a group of time series is called:

  1. AOption (a)

    value index

  2. BOption (b)

    qualitative index

  3. COption (c)

    quantitative index

  4. DOption (d)

    diffusion index

View answer & explanation

Correct answer

Answer: (d)D.

diffusion index

Why this answer is correct

Explanation

Value index = An index number formed from the ratio of aggregate values in the given period to the aggregate values in the base period

Qualitative index = Index of qualitative variation (IQV) A measure of variability for nominal variables. It is based on the ratio of the total number of differences in the distribution to the maximum number of possible differences within the same distribution

Quantitative index = It measures the change in the quantity or volume of goods sold, consumed, or produced during a given time period. ... Hence it is a measure of relative changes over a period of time in the quantities of a particular set of goods

Diffusion index = The degree to which different economic indicators are changing in the same way at a particular time.

∴ The index that indicates the progress or recession of an economic cycle in a group of time series is called the Diffusion index

Question 80

Let θ be the angle made by the line of regression of Y on X. If σY = 2σX and the correlation coefficient between X and Y is 0.3, the value θ equals

  1. AOption (a)

    tan-1 0.3

  2. BOption (b)

    cot-1 0.3

  3. COption (c)

    tan-1 0.6

  4. DOption (d)

    cot-1 0.6

View answer & explanation

Correct answer

Answer: (c)C.

tan-1 0.6

Why this answer is correct

Given

Let θ be the angle made by the line of regression of Y on X.

σY = 2σX and the correlation coefficient between X and Y  = γ =  0.3

Calculation

Let LYX be line of regression of Y on X

Let the angle made by Lyx with x – axis be θ.

∴ Tangent of the angle made by Lyx with x – axis is tan θ.

But slope of any line with x – axis is tan θ

⇒ Slope of Lyx = byx

⇒ byx = tan θ

⇒ byx = γ(σy/σx)

⇒ tan θ = 0.3 × 2(σx/σx)

⇒ tan θ = 0.3 × 2

∴ The value of θ is tan-1(0.6)

Question 81

Among the options for parameters, which option is correct for population?

  1. AOption (a)

    X̅ and μ

  2. BOption (b)

    s and σ

  3. COption (c)

    X̅ and s

  4. DOption (d)

    μ and σ

View answer & explanation

Correct answer

Answer: (d)D.

μ and σ

Why this answer is correct

Explanation

Statistics such as averages and standard deviation when taken from populations are population parameters.

The population mean is denotted by μ and standard deviation denotted by σ 

∴ μ and σ are parameters for population

Mean =  ∑xi/n

Standard deviation = √(∑(xi - x̅)2/n)

Question 82

If in the ANOVA, the sample means for each of k treatment groups were identical, the value of F statistic equals:

  1. AOption (a)

    ∞

  2. BOption (b)

    0

  3. COption (c)

    1

  4. DOption (d)

    between 0 and 1

View answer & explanation

Correct answer

Answer: (b)B.

0

Why this answer is correct

Formula

F = MSC/MSE

MSC = Variance between the sample

MSE = Variance within the sample

Calculation

It is given that the sample mean for each of k treatment group were identical that mean (k = 1)

Degree of freedom between the sample = k - 1

⇒ 1 - 1 = 0

∴ F- Statistics is 0 if the sample for each k treatment group were identical

One way analysis of variance or one-way classification table is as follows

Source of variationSum of squaresDegree of freedomMean squares
Between samples within samplesSSC SSEK – 1 N – KMSC MSE
TotalSSTN - 1

SST = Total sum of the square

SST = Sum of the square of the column

SSE = Sum of the square of the Error

MSC = Variance between samples

MSE = Variance within the samples

Question 83

The variability of the sample treatment means around the overall mean is depicted by the _______ sum of squares.

  1. AOption (a)

    treatment

  2. BOption (b)

    error

  3. COption (c)

    interaction

  4. DOption (d)

    total

View answer & explanation

Correct answer

Answer: (a)A.

treatment

Why this answer is correct

Explanation

MST = Mean square of treatment

SST = Treatment sum of square

MST = SST/k - 1

whereas, k = number of sample size

∴ The variability of the sample treatment means around the overall mean is depicted by the Treatment sum of square

Question 84

If 't’ is the true value and ‘e’ is its measured value of the observation, the relative error is:

  1. AOption (a)

    t−et\dfrac{t - e}{t}

  2. BOption (b)

    te\dfrac{t }{e}

  3. COption (c)

    ∣t−e∣t\dfrac{|t - e|}{t}

  4. DOption (d)

    t−ee\dfrac{t - e}{e}

View answer & explanation

Correct answer

Answer: (c)C.

∣t−e∣t\dfrac{|t - e|}{t}

Why this answer is correct

Explanation

Relative error represents the ratio of the absolute error of the measurement to the accepted measurement. This way we can determine the magnitude of the absolute error in terms of the actual size of the measurement.

If the true measurement of the object is not known then the relative error is found using the measured

∴ The expression for relative error is I t – e I/t

Question 85

For the data on early earning of employees in a company, the raw moments about some arbitrary point A = 120 is given by μ1' = -3.66, μ2' = 940. The moment μ2 about actual mean 940 is:

  1. AOption (a)

    916.55

  2. BOption (b)

    926.55

  3. COption (c)

    906.55

  4. DOption (d)

    936.55

View answer & explanation

Correct answer

Answer: (b)B.

926.55

Why this answer is correct

Given

μ’1 = - 3.66

μ’2 = 940

Formula

μ2 = μ’2 – μ’21

μ2 = Second moment about mean

μ’1 and μ’2 are raw moment about any arbituary point

Calculation

The moment μ2 about mean = μ’2 – μ’21

⇒ 940 – (-3.66)2

⇒ 940 – 13.39

⇒ 926.55

∴ The moment μ2 about mean 940 is 926.55

\


Moment

Moments are a set of statistical parameters to measure a distribution. Four moments are commonly used:

1 – Mean or the average

2 - Variance:

Standard deviation is the square root of the variance: an indication of how closely the values are spread about the mean. A small standard deviation means the values are all similar. If the distribution is normal, 63% of the values will be within the  standard deviation.

3 - Skewness: measure the asymmetry of a distribution about its peak;

It is a number that describes the shape of the distribution.

It is often approximated by Skew = (Mean - Median) / (Std dev).

If skewness is positive, the mean is bigger than the median and the distribution

The relation in mean, median and mode in positive skewed

Mean > Median > Mode

has a large tail of high values.

If skewness is negative, the mean is smaller than the median and the distribution has a large tail of small values.

The relation in mean, median and mode in positive skewed

Mean < Median < Mode

4 - Kurtosis: measures the peakedness or flatness of a distribution.

Positive kurtosis shows a thin pointed distribution.

Negative kurtosis shows a broad flat distribution

Question 86

For the joint density fxy(x, y) = x2 + Cy; 0 ≤ x ≤ 1, 0 ≤ y ≤ 1,  the value of constant C is:

  1. AOption (a)

    4/3

  2. BOption (b)

    1/3

  3. COption (c)

    1

  4. DOption (d)

    2/3

View answer & explanation

Correct answer

Answer: (a)A.

4/3

Why this answer is correct

Concept used

We know that the probability of joint density ∬\iint fxy(xy)dxdy

Calculation

∬x=0y=0x=1y=1\mathop \iint \limits_{x = 0y = 0}^{x = 1y = 1}  (x2 + Cy)dxdy = 1

After integration we get

⇒ (x3/3)10 + C(y2/2)10 = 1

⇒ (1/3) + (1/2)C = 1

⇒ (1/2)C = 1 – 1/3

⇒ C(1/2) = 2/3

⇒ C = 4/3

∴ The value of C is 4/3

Question 87

We have sampled 64 units from the latest production lot to depict the weight of the product, and the sample mean is 10.40 Ibs. If the population standard deviation is known to be 0.40 lbs, then the 95% confidence interval is:

  1. AOption (a)

    10.4 ± 0.392

  2. BOption (b)

    10.4 ± 0.098

  3. COption (c)

    10.4 ± 0.196

  4. DOption (d)

    10.4 ± 0.049

View answer & explanation

Correct answer

Answer: (b)B.

10.4 ± 0.098

Why this answer is correct

Given

n = sample = 64

sample mean = X̅ = 10.40

Zα/2 = 1.96

Formula

X̅ ∓ Zα/2σ/√n

Calculation

⇒ 10.4 ± 1.96 × 0.4/√64

⇒ 10.4 ± 1.96 × 0.4/8

⇒ 10.4 ± 1.96 × 1/20

∴ The 95% confidence interval is: 10.4 ± 0.098

Question 88

The number of ‘likes’ on the last four photos posted on Facebook is 3, 15, 21, and 13. The mean absolute deviation value about the mean of ‘likes’ is:

  1. AOption (a)

    7

  2. BOption (b)

    6

  3. COption (c)

    5

  4. DOption (d)

    4

View answer & explanation

Correct answer

Answer: (c)C.

5

Why this answer is correct

Given

The number of ‘likes’ on the last four photos posted on Facebook is 3, 15, 21, and 13

Gormula

Mean = ∑xi/n

Absolute mean deviation = 1/n(∑I xi – x̅)

Calculation

Mean = x̅ = (3 + 15 + 21 + 13)/4

⇒ x̅ = 13

Mean about absolute deviation = 1/4(I 3 – 13 I + I 15 – 13 I + I 21 – 13 I + I 13 – 13I

⇒ 1/4(10 + 2 + 8 + 0)

⇒ 1/4( 20)

∴ Mean about absolute deviation is 5

Question 89

In a cluster sampling wherein the units within same cluster are highly correlated, suppose Sw2S_w^2 represents the variance within the clusters and Sb2S_b^2 between clusters, then which option is correct?

  1. AOption (a)

    Sw2S_w^2 is greater than and equal to Sb2S_b^2

  2. BOption (b)

    Sw2S_w^2  is equal to Sb2S_b^2

  3. COption (c)

    Sw2S_w^2 is lesser than and equal to Sb2S_b^2

  4. DOption (d)

    Sw2S_w^2  and Sb2S_b^2 are not comparable

View answer & explanation

Correct answer

Answer: (c)C.

Sw2S_w^2 is lesser than and equal to Sb2S_b^2

Why this answer is correct

Explanation

In cluster sampling, researchers divide a population into smaller groups known as clusters.  They then randomly select among these clusters to form a sample.

Cluster sampling is a method of probability sampling that is often used to study large populations, particularly those that are widely geographically dispersed. Researchers usually use pre-existing units such as schools or cities as their clusters.

In cluster sampling the variance within the clusters is lesser than the variance between clusters

∴ S2w is lesser than and equal to S2b

Question 90

A clinical researcher wants to estimate the mean iron level of all females in the age group of 20 to 29. How many minimum subjects are needed to estimate the mean iron level within 2 points with 99% confidence, assuming s = 19.1 based on earlier studies?

  1. AOption (a)

    609

  2. BOption (b)

    610

  3. COption (c)

    605

  4. DOption (d)

    607

View answer & explanation

Correct answer

Answer: (c)C.

605

Why this answer is correct

Formula

n = (Zα/2 × S/E)2

Given

Zα/2 = 2.576

S = 19.1

E = 2

Calculation

n = (2.576 × 19.1/2)2

⇒ n = (24.6008)2

∴ The minimum subjects are needed to estimate the mean iron level within2 points with 99% confidence is 605.19 or 605

Question 91

When the k population means are truly distinct from each other, it is expected that:

  1. AOption (a)

    The average error deviation differ significantly between at least two of the populations

  2. BOption (b)

    the average treatment deviation is relatively small related to the average error deviation

  3. COption (c)

    the average treatment deviation is relatively large related to the average error deviation

  4. DOption (d)

    the average treatment deviation is about equal to the average error deviation

View answer & explanation

Correct answer

Answer: (c)C.

the average treatment deviation is relatively large related to the average error deviation

Why this answer is correct

Explanation

When the k population mean are truely distinct from each other it means that the average treatment deviation is relatively large related to the average error deviation.

Question 92

For the distribution f(x)=(x−3)25;x=3,4,5f(x) = \dfrac{(x - 3)^2}{5}; x = 3, 4, 5 the value of the third moment about origin is:

  1. AOption (a)

    125.80

  2. BOption (b)

    120.80

  3. COption (c)

    112.80

  4. DOption (d)

    124.80

View answer & explanation

Correct answer

Answer: (c)C.

112.80

Why this answer is correct

Formula

μ3 = Third moment

μ3 = E(X3)

Given

F(x) = (x – 3)2/5, x = 3, 4, 5

Calculation

E(X3) = ∑x3 × f(x)

⇒ 33 × (3 – 3)2/5 + 43 × (4 – 3)2/5 + 53 × (5 – 3)2/5

⇒ 27 × 0 + 64 × 1/5 + 125 × 4/5

⇒ 64/5 + 500/5

⇒ 100 + 12.8

∴ The value of third moment about origin is 112.8

Question 93

A fair six-sided die is rolled, with X being the number on the uppermost face. The variance of X is:

  1. AOption (a)

    3512\dfrac{35}{12}

  2. BOption (b)

    2512\dfrac{25}{12}

  3. COption (c)

    256\dfrac{25}{6}

  4. DOption (d)

    356\dfrac{35}{6}

View answer & explanation

Correct answer

Answer: (a)A.

3512\dfrac{35}{12}

Why this answer is correct

Formula

Variance X = σ2x = E[(X – μ)2] = E(X2) – [E(X)]2

Calculation

XP(X)
11/6
21/6
31/6
41/6
51/6
61/6

E(X) = μx = μ

⇒ μ = ∑ xifi = ∑xiP(X = xj)

⇒ 1 × 1/6 + 2 × 1/6 + 3 × 1/6 + 4 × 1/6 + 5 × 1/6 + 6 × 1/6

⇒ (1/6)(1 + 2 + 3 + 4 + 5 + 6)

⇒ 7/2

E(X2) = ∑xj2f(xj) = ∑xj2P(X = xj)

⇒ 12 × 1/6 + 22 × 1/6 + ------62 × 1/6

⇒ 1/6(12 + 22 + 32 + 42 + 52 + 62)

⇒ 1/6(1 +4 + 9 + 16 + 25 + 36)

⇒ 91/6

Variance X = E(X2) – [E(X)]2

⇒ 91/6 – (7/2)2

⇒ 91/6 – 49/4

∴ Variance X is 35/12

Question 94

The data relating to the marks, out of 100, of 8 students in an examination is given as follows.

25, 48, 32, 52, 21, 64, 29, 57

The values of Q1, and Q3, respectively, for this data are:

  1. AOption (a)

    (26.25, 55.75)

  2. BOption (b)

    (25.75, 54.50)

  3. COption (c)

    (26.00, 55.75)

  4. DOption (d)

    (25.50, 55.50)

View answer & explanation

Correct answer

Answer: (c)C.

(26.00, 55.75)

Why this answer is correct

Given

Data of 8 students = 25, 48, 32, 52, 21, 64, 29, 57

Formula

Q1 = (n + 1)/4 th term

Q3 = 3(n + 1)/4 th term

Calculation

First arrange the data in ascending order

⇒ 21, 25, 29, 32, 48, 52, 57, 64

Q1 = (n + 1)/4 th term

⇒ (8 + 1)/4 = 2.25th term

⇒ 2nd  term + 1/4( 3rd term – 2nd term)

⇒ 25 + 1/4(29 – 25)

⇒ 25 + 4 × 1/4

∴ Q1 = 26

Q3 = 3(n + 1)/4 th term

⇒ 3 × (8 + 1)/4 = 27/4 = 6.75 th term

⇒ 6th term + 3/4 ( 7th term – 6th term)

⇒ 52 + 3/4 (57 – 52)

⇒ 52 + 5 × 3/4 = 52 + 15/4 = 52 + 3.75 = 55.75

∴ Q3 = 55.75

∴ The value of Q1 and Q3 are 26 and 55.75


It is a value that divides a set of data into 4 equal parts.

The three quartiles are

Q1 = First or lower quartile

Q2 = Second quartile or median

Q3 = Third or upper quartile

Median = Q2 = (Q1 + Q3)/2 for symmetrical distribution

Quartile deviation = (Q3 – Q1)/2

Question 95

The multiple correlation coefficient R1,23 as compared to any simple correlation coefficients between the distinct variable X1 ,X2, and X3 is

  1. AOption (a)

    always equal to the product of r12, r13 and r23

  2. BOption (b)

    less than any r12, r23, r13

  3. COption (c)

    not less than any r12, r13 and r23

  4. DOption (d)

    always equal to the sum of r12, r13 and r23

View answer & explanation

Correct answer

Answer: (c)C.

not less than any r12, r13 and r23

Why this answer is correct

Given

Multiple correlation coefficient = R1.23

Explanation

For multiple correlation coefficient,

⇒ R1.23 ≥ r12 × r13 × r23

From given expression we can say that

∴ The multiple correlation coefficient R1,23 as compared to any simple correlation coefficients between the distinct variable X1 ,X2, and X3 is not less than any r12, r13 and r23

Question 96

In some of the real-life situations, a researcher has to explore two or more treatments at the same time. This type of experimental design is referred to as:

  1. AOption (a)

    contingency table design

  2. BOption (b)

    completely randomised design

  3. COption (c)

    randomised block design

  4. DOption (d)

    factorial design

View answer & explanation

Correct answer

Answer: (d)D.

factorial design

Why this answer is correct

Explanation

Contingency table design A contingency table provides a way of portraying data that can facilitate calculating probabilities. The table helps in determining conditional probabilities quite easily. The table displays sample values in relation to two different variables that may be dependent or contingent on one another.

Completely randomised design =  completely randomized design (CRD) is one where the treatments are assigned completely at random so that each experimental unit has the same chance of receiving any one treatment

randomized block design = he randomized complete block design (RCBD) is a standard design for agricultural experiments in which similar experimental units are grouped into blocks or replicates. It is used to control variation in an experiment by, for example, accounting for spatial effects in field or greenhouse

 factorial design = In statistics, a full factorial experiment is an experiment whose design consists of two or more factors, each with discrete possible values or "levels", and whose experimental units take on all possible combinations of these levels across all such factors

∴ Factorial design is the correct answer

Question 97

Fisher’s index number formula satisfies which of the following?

(I) Unit test

(II) Factor reversal test

(III) Time reversal test

  1. AOption (a)

    Only I and III

  2. BOption (b)

    Only I and II

  3. COption (c)

    All I, II and III

  4. DOption (d)

    Only I

View answer & explanation

Correct answer

Answer: (c)C.

All I, II and III

Why this answer is correct

Explanation

For Unit test

This test states that the formula for constructing an index number should be independent of the units in which prices and quantities are expressed. All the methods except simple aggregative method, satisfy this test

The time reversal test is satisfied if P01 × P10 = 1

⇒ P01 =√[(∑(p1qo/∑poqo) × (∑p1q1/∑poq1]

⇒ P10 = √[(∑(p0q1/∑p1q1) × (∑p0q0 /∑p1q0]

⇒ P01 × P10 = √(∑(p1qo/∑poqo) × (∑p1q1/∑poq1 × ∑(p0q1/∑p1q1) × (∑p0q0 /∑p1q0]

∴ P01 × P10 = 1 which satisfied time reversal test

For factor reversal test

P01 × Q01 = ∑P1Q1/∑P0Q0

⇒ P01  = √[(∑(p1qo/∑poqo) × (∑p1q1/∑poq1]

⇒ Q01 = √[(p0q1/∑p0q0) × (∑p1q1/∑p1q0)

⇒ P01 × Q01 = √[(∑(p1qo/∑poqo) × (∑p1q1/∑poq1) × (p0q1/∑p0q0) × (∑p1q1/∑p1q0)]

⇒ p01 × Q01 = ∑ p1q1∑p0q0

⇒ Factor reversal test is also satisfied

∴ Fisher’s ideal index number satisfied unit test, time reversal and factor reversal test

Question 98

For any two independent events A and B, P(A - B) is equal to:

  1. AOption (a)

    P(A) - P(A)P(B)

  2. BOption (b)

    P(B) - P(A)

  3. COption (c)

    P(B) (1 - P(AB))

  4. DOption (d)

    P(A) - P(B)

View answer & explanation

Correct answer

Answer: (a)A.

P(A) - P(A)P(B)

Why this answer is correct

Given:

Two independent events A and B

Formula Used:

P(A - B) = P(A) - P(A ∩ B)

For independent events, P(A ∩ B) = P(A) × P(B)

Calculation:

We need to find P(A - B).

P(A - B) = P(A) - P(A ∩ B)

Since A and B are independent events:

P(A ∩ B) = P(A) × P(B)

Therefore, P(A - B) = P(A) - P(A) × P(B)

Solution:

P(A - B) = P(A) - P(A) × P(B)

P(A - B) = P(A)(1 - P(B))

Therefore, P(A - B) = P(A)(1 - P(B)).

Question 99

Given the regression lines X + 2Y - 5 = 0, 2X + 3Y - 8 = 0 and Var(X) = 12, the value of Var(Y) is

  1. AOption (a)

    3/4

  2. BOption (b)

    4/3

  3. COption (c)

    16

  4. DOption (d)

    4

View answer & explanation

Correct answer

Answer: (d)D.

4

Why this answer is correct

Given

Regression lines

x + 2y - 5 = 0

2x + 3y - 8 = 0

var(x)= σx = 12

Calculation

x + 2y - 5 = 0    ------(i)

Let y = - x/2 + 5/2 be the regression line of y on x [ from equation 1]

2x + 3y - 8

x = -(3/2)y + 8/2 be the regressiopn line of x on y

⇒ byx = -1/2 and bxy = -3/2

bxy = Regression line of y on x

byx = Regression line of x on y

We know that regression coefficient = r = √(byx × bxy)

⇒ r = √(-1/2 × -3/2)

Since both bxy and byx are negative r is also negative

∴ r = -√3/2 < 1

σx = 12\sqrt{12} = 2√3

We know that byx = r (σy/σx)

⇒ -1/2 = -√3/2 (σy/2√3)

⇒ σy =  2

∴ var(y) = variance of y =(2)2 = 4

Question 100

Let X be the discrete random variable with PMF (x) = 12x\dfrac{1}{2^x}; x = 1,2,3,.... The value of P(X > 4) is

  1. AOption (a)

    1516\frac{15}{16}

  2. BOption (b)

    916\frac{9}{16}

  3. COption (c)

    516\frac{5}{16}

  4. DOption (d)

    116\frac{1}{16}

View answer & explanation

Correct answer

Answer: (d)D.

116\frac{1}{16}

Why this answer is correct

Given

PMF(x) = 1/2x, x = 1, 2, 3 -----

Formula

P(X > 4) = 1 – P(X ≤ 4)

Calculation

P(X > 4) = 1 – P(X ≤ 4)

⇒ 1 – [P(X = 1) + P(X = 2) + P(X = 3) + P(X = 4)]

⇒ 1 – [1/21 + ½2  + ½3 + ½4]

⇒ 1 – [1/2 + ¼ + 1/8 + 1/16]

⇒ 1 – [(8 + 4 + 2 + 1)/16]

⇒ 1 – [15/16]

⇒ (16 – 15)/16

∴ The value of P(X > 4) is 1/16


Probability mass function or  PMF is defined as the set of ordered pair [x, f(x)] if for each possible outcome x, f(x) satisfies the following condition

F(x) ≥ 0

∑ f(x) = 1

100 questions in the full paper