Given:
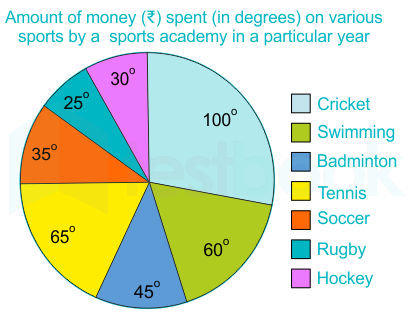
The degrees representing each sport in the pie chart are:
Soccer = 35°
Badminton = 45°
Tennis = 65°
Rugby = 25°
Cricket = 100°
Swimming = 60°
Hockey = 30°
₹42,000 were spent on Soccer, which corresponds to 35°.
We need to find the total expenditure and the percentage comparison of money spent on Badminton, Tennis, and Rugby versus Cricket, Swimming, and Hockey.
Formula used:
The total expenditure can be found by using the ratio of expenditure on Soccer (35°) to the total degrees (360°):
3542,000=360T
Calculations:
From the equation, we can find the total expenditure (T):
T=3542,000×360=432,000
So, the total expenditure is ₹432,000.
Now, let's calculate the money spent on Badminton, Tennis, and Rugby:
The degrees for Badminton, Tennis, and Rugby = 45° + 65° + 25° = 135°.
So, the money spent on these sports is:
360135×432,000=162,000
Thus, ₹162,000 is spent on Badminton, Tennis, and Rugby.
Next, we calculate the money spent on Cricket, Swimming, and Hockey:
The degrees for Cricket, Swimming, and Hockey = 100° + 60° + 30° = 190°.
So, the money spent on these sports is:
360190×432,000=228,000
Thus, ₹228,000 is spent on Cricket, Swimming, and Hockey.
Now, we need to find the percentage difference between the money spent on Badminton, Tennis, and Rugby and the money spent on Cricket, Swimming, and Hockey:
The percentage difference is given by:
228,000162,000−228,000×100=228,000−66,000×100=−28.95%
The money spent on Badminton, Tennis, and Rugby is 28.95% less than the money spent on Cricket, Swimming, and Hockey.