Search Previous Year Questions

Find real questions from previous competitive exam papers with answers and solutions.

Browse complete papers
100 matching questions · Page 9
Clear

Question 81

UPSSSC Lower PCS 2023• Full Test

The given Line graph Data Interpretation Chart shows the sales of shoes (in thousands) from six stores in six different cities Kolkata, Patna, Dhanbad, Ranchi, Asansol and Gaya during three consecutive years 2020, 2021 and 2022 :
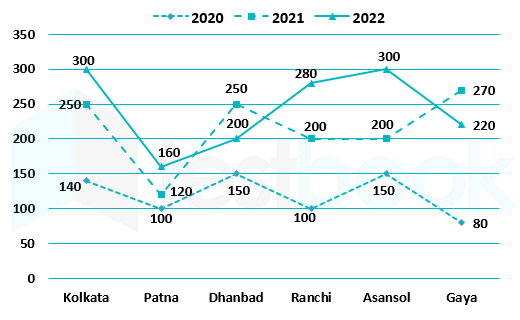
What is the ratio of the total sales of Patna store for three years to the total sales of Asansol store for three years?

  1. AOption (a)

    190/325

  2. BOption (b)

    380/640

  3. COption (c)

    30/61

  4. DOption (d)

    172/189

View answer & explanation

Correct answer

Answer: (a)A.

190/325

Why this answer is correct

Given:

The total sales of Patna store for three years = 100 + 120 + 160 = 380

The total sales of Asansol store for three years = 150 + 200 + 300 = 650

Required = 380/650 = 190/325

Question 82

UPSSSC Lower PCS 2023• Full Test

The given Line graph Data Interpretation Chart shows the sales of shoes (in thousands) from six stores in six different cities Kolkata, Patna, Dhanbad, Ranchi, Asansol and Gaya during three consecutive years 2020, 2021 and 2022 :

Total number of shoes sales on Gaya store and Patna store together for three years is approximately what percent of the total sales of Dhanbad store and Ranchi store together for three years ?

  1. AOption (a)

    72.23%

  2. BOption (b)

    76.75%

  3. COption (c)

    80.51% 

  4. DOption (d)

    86.81%

View answer & explanation

Correct answer

Answer: (c)C.

80.51% 

Why this answer is correct

Calculation:

Total number of shoes sales on Gaya store and Patna store together for three years = (80 + 220 + 270 + 100 + 120 + 160) = 950

The total sales of Dhanbad store and Ranchi store together for three years = (150 + 200 + 250 + 100 + 200 + 280) = 1180

Required Percentage = 950/1180 × 100 = 80.51%

Question 83

UPSSSC Lower PCS 2023• Full Test

The given Line graph Data Interpretation Chart shows the sales of shoes (in thousands) from six stores in six different cities Kolkata, Patna, Dhanbad, Ranchi, Asansol and Gaya during three consecutive years 2020, 2021 and 2022 :

What percent of the average sales of shoes on Kolkata store, Patna store and Dhanbad store in 2021 is the average sales of shoes on Ranchi store, Asansol store and Gaya store in 2022 ?

  1. AOption (a)

    86.12% 

  2. BOption (b)

    77.5%

  3. COption (c)

    129.03%

  4. DOption (d)

    93.94%

View answer & explanation

Correct answer

Answer: (c)C.

129.03%

Why this answer is correct

the average sales of shoes on Kolkata store, Patna store and Dhanbad store in 2021 = (250 + 120 + 250)/3 = 620/3 

The average sales of shoes on Ranchi store, Asansol store and Gaya store in 2022 = (280 + 300 + 220)/3 = 800/3

Required % = (800/3)/(620/3) × 100 = 129.03%

Question 84

UPSSSC Lower PCS 2023• Full Test

The given Line graph Data Interpretation Chart shows the sales of shoes (in thousands) from six stores in six different cities Kolkata, Patna, Dhanbad, Ranchi, Asansol and Gaya during three consecutive years 2020, 2021 and 2022 :

What is the ratio of average sales of shoes of all the stores for the year 2020 to average sales of shoes of all the stores for the year 2021 ?

  1. AOption (a)

    45/59 

  2. BOption (b)

    24/43 

  3. COption (c)

    121/253

  4. DOption (d)

    122/216

View answer & explanation

Correct answer

Answer: (b)B.

24/43 

Why this answer is correct

The average sales of shoes of all the stores for the year 2020 = (140 + 100 + 150 + 100 + 150 + 80)/6 = 720/6 = 120

The average sales of shoes of all the stores for the year 2021 = (250 + 120 + 250 + 200 + 200 + 270)/6 = 1290/6 = 215

Required ratio = 120/215 = 24/43

Question 85

UPSSSC Lower PCS 2023• Full Test

The given Line graph Data Interpretation Chart shows the sales of shoes (in thousands) from six stores in six different cities Kolkata, Patna, Dhanbad, Ranchi, Asansol and Gaya during three consecutive years 2020, 2021 and 2022 :

What is the total number of shoes sales of Kolkata store, Patna store and Ranchi store together for three years?

  1. AOption (a)

    1140 

  2. BOption (b)

    1250 

  3. COption (c)

    1650 

  4. DOption (d)

    1820

View answer & explanation

Correct answer

Answer: (c)C.

1650 

Why this answer is correct

Calculation: 

The total number of shoes sales of Kolkata store, Patna store and Ranchi store together for three years =  690 + 380 + 580 = 1650