Search Previous Year Questions

Find real questions from previous competitive exam papers with answers and solutions.

Leave the keyword blank to browse saved questions for your selected exam, newest papers first. Add a keyword, year or topic to narrow the results.

Browse complete papers
Showing 10 question(s)
Clear

Question 91

OSSC Traffic Constable 2024• Data Interpretation
Table depicts the Sale of Pain killers in PNKV Hospital, Sale in thousand strips (of ten tablet each)
List of Pain killers20102011201220132014
IRAMADOL670720810890990
COMBIFAM850910890930970
DISPRIN640730790810750
CAIPOL10101120140013601410
PROXYM13401370138013901410
VOBERON45104850527053805530

Refer to the figure given to answer the question

What is the ratio of sale of Disprin to the total sale of pain killers during the year 2010 ?

  1. AOption (a)

    1/15

  2. BOption (b)

    32/451

  3. COption (c)

    902/85

  4. DOption (d)

    850/4510

View answer & explanation

Correct answer

Answer: (a)A.

1/15

Explanation not yet available.

Question 92

OSSC Traffic Constable 2024• Data Interpretation

Refer to the figure given and answer the question:

What was the rate of growth in production in the year 1999 compared to year 1996 ?

  1. AOption (a)

    8.2%

  2. BOption (b)

    6.9%

  3. COption (c)

    4.6%

  4. DOption (d)

    2.8%

View answer & explanation

Correct answer

Answer: (a)A.

8.2%

Explanation not yet available.

Question 93

OSSC Traffic Constable 2024• Data Interpretation

Refer to the figure given below and answer the question:

Image displays the speeds at which Surya drove on a Saturday evening

The distance traveled by Surya in miles between 8 : 30 AM to 9 AM is:

  1. AOption (a)

    15 miles

  2. BOption (b)

    25 miles

  3. COption (c)

    10 miles

  4. DOption (d)

    20 miles

View answer & explanation

Correct answer

Answer: (a)A.

15 miles

Explanation not yet available.

Question 94

OSSC Traffic Constable 2024• Data Interpretation

Instruction: Refer to the figure given below for the following question. Select the most appropriate answer from the choices given, based on the data provided.

In which year the value per quantity is higher?

  1. AOption (a)

    1996 

  2. BOption (b)

    2000

  3. COption (c)

    1999 

  4. DOption (d)

    1998

View answer & explanation

Correct answer

Answer: (a)A.

1996 

Explanation not yet available.

Question 95

OSSC Traffic Constable 2024• Data Interpretation

Refer to the figure given below and answer the question:

Which among the given options is correct?

  1. AOption (a)

    The ratio of medicine expense to grocery is equal to 3/5.

  2. BOption (b)

    The ratio of medicine to grocery is equal to the ratio of savings to rent.

  3. COption (c)

    The ratio of savings and rent is equal to that of transport and Medicine.

  4. DOption (d)

    Sum of savings and rent is equal to three fifth of total expenses.

View answer & explanation

Correct answer

Answer: (a)A.

The ratio of medicine expense to grocery is equal to 3/5.

Explanation not yet available.

Question 96

OSSC Traffic Constable 2024• Data Interpretation

The given pie chart show the time spent by a student on daily basis.

What is the time spent on watching TV by the student for a month?

  1. AOption (a)

    3 days

  2. BOption (b)

    5 days

  3. COption (c)

    1 days

  4. DOption (d)

    2 days

View answer & explanation

Correct answer

Answer: (a)A.

3 days

Explanation not yet available.

Question 97

OSSC Traffic Constable 2024• Data Interpretation

Read the question and statements provided and then decide whether the data provided in the statements are sufficient/required to answer the question.

Karan has a total of 98 red and white balls. How many red balls does he have?

Statements:

I. By decreasing the number of white balls by 3 and increasing the red balls by 4, the white balls will be half the number of red balls

II. White balls are more than half of red balls.

  1. AOption (a)

    Either statement I or II is sufficient

  2. BOption (b)

    Statement I alone is sufficient

  3. COption (c)

    Statement II alone is sufficient

  4. DOption (d)

    Both statement I and II is required.

View answer & explanation

Correct answer

Answer: (a)A.

Either statement I or II is sufficient

Explanation not yet available.

Question 98

OSSC Traffic Constable 2024• Data Interpretation

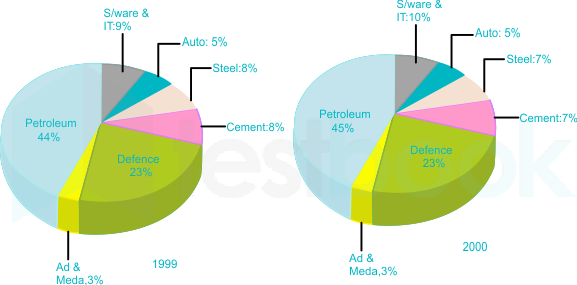
Refer to the figure given below for the GDP of various sectors in the given years for the following question. Select the most appropriate answer from the choices given, based on the data provided.

How many industries registered a loss in the GDP in 2000 in comparison to 1999 ?

  1. AOption (a)

    0

  2. BOption (b)

    1

  3. COption (c)

    2

  4. DOption (d)

    3

View answer & explanation

Correct answer

Answer: (a)A.

0

Explanation not yet available.

Question 99

OSSC Traffic Constable 2024• Data Interpretation

A manufacturing plant produced three types of products - X, Y, and Z. The production quantities for each product over four quarters are given in the table below.

Calculate the percentage increase in production of Product X from Quarter 2 to Quarter 4.

QuarterXYZ
Q1500600300
Q2600550350
Q3700700400
Q4800750450
  1. AOption (a)

    42%

  2. BOption (b)

    33.33%

  3. COption (c)

    47.55%

  4. DOption (d)

    20%

View answer & explanation

Correct answer

Answer: (a)A.

42%

Explanation not yet available.

Question 100

OSSC Traffic Constable 2024• Data Interpretation

Instruction: Refer to the figure given below for the following question.

Select the most appropriate answer from the choices given, based on the data provided.

The bar graph gives the number of items sold in 10000 by a company. Which of the following is true?

  1. AOption (a)

    The number of item sold in item A and item E accounts for the half of the total items sold by the company.

  2. BOption (b)

    The number of items sold in product A accounts for 1/4th of the total sale.

  3. COption (c)

    The total number of items sold in product E and F accounts for 3/8th of the total sale.

  4. DOption (d)

    The mean of total product sold is 8300.

View answer & explanation

Correct answer

Answer: (a)A.

The number of item sold in item A and item E accounts for the half of the total items sold by the company.

Explanation not yet available.