Search Previous Year Questions

Find real questions from previous competitive exam papers with answers and solutions.

Leave the keyword blank to browse saved questions for your selected exam, newest papers first. Add a keyword, year or topic to narrow the results.

Browse complete papers
Showing 10 question(s)
Clear

Question 151

IDBI Executive 2023• Logical Reasoning, Data Analysis & Interpretation

Directions: Answer the questions based on the information given below.

The pie chart given below shows the percentage distribution of the total number of (comedy + horror) movies watched by five different persons in a year.
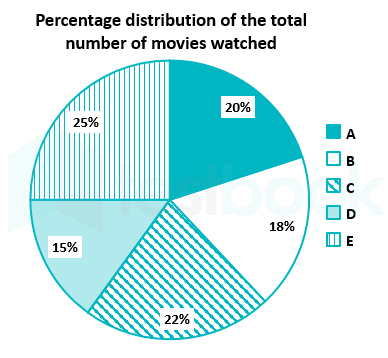
The table given below shows the difference between the number of comedy and horror movies watched by a person in the same given year.

PersonDifference between the number of comedy and horror movies watched
A100
B150
C170
D125
E225


Note :

(1) Total number of movies watched by a person = The number of comedy movies watched + The number of horror movies watched by that person.

(2) The total number of movies watched by all five persons together in the given year = 1500.

(3) Each person has watched a greater number of comedy movies than horror movies.

If the number of comedy movies watched by person 'A' had been 37.5% more and the number of horror movies watched by person 'E' had been 33.33% less, then the sum of the total number of comedy movies watched by 'A' and the number of horror movies watched by 'E' together would be what percentage of the total number of (comedy + horror) movies watched by person 'D'?

  1. AOption (a)

    141.11%

  2. BOption (b)

    142.22%

  3. COption (c)

    143.33%

  4. DOption (d)

    144.44%

  5. EOption (e)

    145.55%

View answer & explanation

Correct answer

Answer: (a)A.

141.11%

Explanation not yet available.

Question 152

IDBI Executive 2023• Logical Reasoning, Data Analysis & Interpretation

Directions: Answer the questions based on the information given below.

The pie chart given below shows the percentage distribution of the total number of (comedy + horror) movies watched by five different persons in a year.

The table given below shows the difference between the number of comedy and horror movies watched by a person in the same given year.

PersonDifference between the number of comedy and horror movies watched
A100
B150
C170
D125
E225


Note :

(1) Total number of movies watched by a person = The number of comedy movies watched + The number of horror movies watched by that person.

(2) The total number of movies watched by all five persons together in the given year = 1500.

(3) Each person has watched a greater number of comedy movies than horror movies.

If the number of comedy movies watched by person 'X' is 20% more than that by person 'D' and the total number of movies (comedy + horror) watched by person 'X' is 88.88% of that by person 'B', then what is the average number of horror movies watched by person 'A', 'C' and 'X' together?

  1. AOption (a)

    50

  2. BOption (b)

    60

  3. COption (c)

    70

  4. DOption (d)

    80

  5. EOption (e)

    90

View answer & explanation

Correct answer

Answer: (a)A.

50

Explanation not yet available.

Question 153

IDBI Executive 2023• Logical Reasoning, Data Analysis & Interpretation

Directions: Answer the questions based on the information given below.

The pie chart given below shows the percentage distribution of the total number of (comedy + horror) movies watched by five different persons in a year.

The table given below shows the difference between the number of comedy and horror movies watched by a person in the same given year.

PersonDifference between the number of comedy and horror movies watched
A100
B150
C170
D125
E225


Note :

(1) Total number of movies watched by a person = The number of comedy movies watched + The number of horror movies watched by that person.

(2) The total number of movies watched by all five persons together in the given year = 1500.

(3) Each person has watched a greater number of comedy movies than horror movies.

If the average number of total comedy movies watched by person 'B', 'E', and 'Y' together is 260, and the ratio between the number of horror to comedy movies watched by person 'Y' is 5 : 18 respectively, then the total number of movies (comedy + horror) watched by person 'Y' is how much percent more/less than that by person 'E'?

  1. AOption (a)

    4%

  2. BOption (b)

    5%

  3. COption (c)

    6%

  4. DOption (d)

    7%

  5. EOption (e)

    8%

View answer & explanation

Correct answer

Answer: (a)A.

4%

Explanation not yet available.

Question 154

IDBI Executive 2023• Logical Reasoning, Data Analysis & Interpretation

Directions: Answer the questions based on the information given below.

The pie chart given below shows the percentage distribution of the total number of (comedy + horror) movies watched by five different persons in a year.

The table given below shows the difference between the number of comedy and horror movies watched by a person in the same given year.

PersonDifference between the number of comedy and horror movies watched
A100
B150
C170
D125
E225


Note :

(1) Total number of movies watched by a person = The number of comedy movies watched + The number of horror movies watched by that person.

(2) The total number of movies watched by all five persons together in the given year = 1500.

(3) Each person has watched a greater number of comedy movies than horror movies.

The number of horror movies watched by person 'Z' is 20% less than the total number of horror movies watched by person 'C' and 'D' together, and the total number of movies (comedy + horror) watched by person 'Z' is 72.72% of that by person 'C'. What is the number of comedy movies watched by person 'Z' in theaters if person 'Z' prefers to watch a comedy movie either in 'theaters' or on 'OTT' platforms and person 'Z' watches 75% of the total number of comedy movies on 'OTT' platforms?

  1. AOption (a)

    34

  2. BOption (b)

    36

  3. COption (c)

    38

  4. DOption (d)

    40

  5. EOption (e)

    42

View answer & explanation

Correct answer

Answer: (a)A.

34

Explanation not yet available.

Question 155

IDBI Executive 2023• Logical Reasoning, Data Analysis & Interpretation

Directions: Answer the questions based on the information given below.

The pie chart given below shows the percentage distribution of the total number of (comedy + horror) movies watched by five different persons in a year.

The table given below shows the difference between the number of comedy and horror movies watched by a person in the same given year.

PersonDifference between the number of comedy and horror movies watched
A100
B150
C170
D125
E225


Note :

(1) Total number of movies watched by a person = The number of comedy movies watched + The number of horror movies watched by that person.

(2) The total number of movies watched by all five persons together in the given year = 1500.

(3) Each person has watched a greater number of comedy movies than horror movies.

The number of comedy movies watched by person 'M' is 6.66% more than that by person 'E' and the number of horror movies watched by person 'M' is 16.66% less than that by person 'B'. What is the difference in the total amount spent by person 'M' on comedy movies and horror movies if the ticket price of each comedy and horror movie watched by person 'M' is 250 Rs?

  1. AOption (a)

    62500 Rs.

  2. BOption (b)

    67500 Rs.

  3. COption (c)

    72500 Rs.

  4. DOption (d)

    77500 Rs.

  5. EOption (e)

    82500 Rs.

View answer & explanation

Correct answer

Answer: (a)A.

62500 Rs.

Explanation not yet available.

Question 156

IDBI Executive 2023• Logical Reasoning, Data Analysis & Interpretation

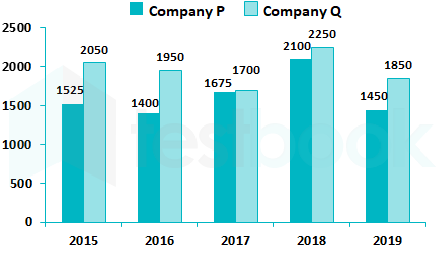
Direction - The following bar graph shows the sales of Bikes of 2 different companies in 5 different years

Total bikes sold by the company P in the year 2015 and 2018 together is approximately what percentage of total bikes sold by both the companies in the year 2018?

  1. AOption (a)

    60%

  2. BOption (b)

    87% 

  3. COption (c)

    45%

  4. DOption (d)

    83.33%

  5. EOption (e)

    None of these

View answer & explanation

Correct answer

Answer: (a)A.

60%

Explanation not yet available.

Question 157

IDBI Executive 2023• Logical Reasoning, Data Analysis & Interpretation

Direction - The following bar graph shows the sales of Bikes of 2 different companies in 5 different years

Find the ratio between the total bikes sold by both the companies in the year 2016 to that of the year 2017?

  1. AOption (a)

    2 : 3 

  2. BOption (b)

    113 : 146 

  3. COption (c)

    107 : 132

  4. DOption (d)

    134 : 135

  5. EOption (e)

    None of these 

View answer & explanation

Correct answer

Answer: (a)A.

2 : 3 

Explanation not yet available.

Question 158

IDBI Executive 2023• Logical Reasoning, Data Analysis & Interpretation

Direction - The following bar graph shows the sales of Bikes of 2 different companies in 5 different years

Find the average number of bikes sold by the company Q in all the given years together?

  1. AOption (a)

    1800

  2. BOption (b)

    1860

  3. COption (c)

    2000

  4. DOption (d)

    1960

  5. EOption (e)

    None of these 

View answer & explanation

Correct answer

Answer: (a)A.

1800

Explanation not yet available.

Question 159

IDBI Executive 2023• Logical Reasoning, Data Analysis & Interpretation

Direction - The following bar graph shows the sales of Bikes of 2 different companies in 5 different years

If the total bikes sold by the company P and Q in the year 2020 is increased by 10 % and 20 % respectively while comparing with the previous year, then find difference between the total number of bikes sold by the company P to that of Q in the year 2020?

  1. AOption (a)

    525

  2. BOption (b)

    500

  3. COption (c)

    600

  4. DOption (d)

    625

  5. EOption (e)

    None of these 

View answer & explanation

Correct answer

Answer: (a)A.

525

Explanation not yet available.

Question 160

IDBI Executive 2023• Logical Reasoning, Data Analysis & Interpretation

Direction - The following bar graph shows the sales of Bikes of 2 different companies in 5 different years

Total bikes sold by company Q in the year 2015 and 2016 together is approximately what percentage more/less than the total bikes sold by the company P in the year 2017 and 2018 together?

  1. AOption (a)

    9%

  2. BOption (b)

    12%

  3. COption (c)

    10%

  4. DOption (d)

    6%

  5. EOption (e)

    None of these 

View answer & explanation

Correct answer

Answer: (a)A.

9%

Explanation not yet available.