Search Previous Year Questions

Find real questions from previous competitive exam papers with answers and solutions.

Leave the keyword blank to browse saved questions for your selected exam, newest papers first. Add a keyword, year or topic to narrow the results.

Browse complete papers
Showing 10 question(s)
Clear

Question 141

IDBI Executive 2023• Logical Reasoning, Data Analysis & Interpretation

Directions: Answer the questions based on the information given below.

A company named 'X' has manufactured a certain number of articles over a span of five different years. The line graph provided below illustrates the number of articles sold by the company in each respective year.
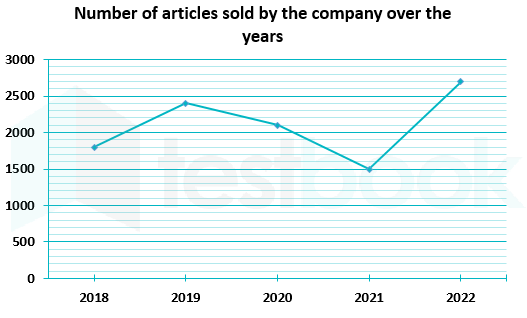
Note :

(1) Total number of articles manufactured by the company in a given year = The number of articles sold + The number of articles unsold during that particular year.

(2) The number of articles sold by the company in each year amounts to 75% of the total number of articles manufactured by the company in that same year.

If the total number of articles manufactured by company 'X' in all five years together is represented as a pie chart, then what is the central angle corresponding to the total number of articles manufactured by company 'X' in 2018 and 2019 together?

  1. AOption (a)

    126°

  2. BOption (b)

    140°

  3. COption (c)

    144°

  4. DOption (d)

    150°

  5. EOption (e)

    162°

View answer & explanation

Correct answer

Answer: (a)A.

126°

Explanation not yet available.

Question 142

IDBI Executive 2023• Logical Reasoning, Data Analysis & Interpretation

Directions: Answer the questions based on the information given below.

A company named 'X' has manufactured a certain number of articles over a span of five different years. The line graph provided below illustrates the number of articles sold by the company in each respective year.

Note :

(1) Total number of articles manufactured by the company in a given year = The number of articles sold + The number of articles unsold during that particular year.

(2) The number of articles sold by the company in each year amounts to 75% of the total number of articles manufactured by the company in that same year.

If the percentage of the number of articles that remained unsold due to 'Defective' errors in 2018, 2019, and 2020 is 15%, 17%, and 14% respectively, then find the average number of total articles that remained unsold due to 'defective' errors in these years by the company?

  1. AOption (a)

    108

  2. BOption (b)

    111

  3. COption (c)

    114

  4. DOption (d)

    117

  5. EOption (e)

    120

View answer & explanation

Correct answer

Answer: (a)A.

108

Explanation not yet available.

Question 143

IDBI Executive 2023• Logical Reasoning, Data Analysis & Interpretation

Directions: Answer the questions based on the information given below.

A company named 'X' has manufactured a certain number of articles over a span of five different years. The line graph provided below illustrates the number of articles sold by the company in each respective year.

Note :

(1) Total number of articles manufactured by the company in a given year = The number of articles sold + The number of articles unsold during that particular year.

(2) The number of articles sold by the company in each year amounts to 75% of the total number of articles manufactured by the company in that same year.

If the total number of articles manufactured by company 'Y' in 2022 is 28.57% of the total number of articles manufactured by company 'X' in 2021 and 2022 together and 40% of the total number of articles manufactured by company 'Y' in 2022 remained unsold, then the number of sold articles by company 'Y' in 2022 is what percentage of the total number of unsold articles by company 'X' in 2020 and 2022 together?

  1. AOption (a)

    40%

  2. BOption (b)

    45%

  3. COption (c)

    50%

  4. DOption (d)

    60%

  5. EOption (e)

    70%

View answer & explanation

Correct answer

Answer: (a)A.

40%

Explanation not yet available.

Question 144

IDBI Executive 2023• Logical Reasoning, Data Analysis & Interpretation

Directions: Answer the questions based on the information given below.

A company named 'X' has manufactured a certain number of articles over a span of five different years. The line graph provided below illustrates the number of articles sold by the company in each respective year.

Note :

(1) Total number of articles manufactured by the company in a given year = The number of articles sold + The number of articles unsold during that particular year.

(2) The number of articles sold by the company in each year amounts to 75% of the total number of articles manufactured by the company in that same year.

If the number of articles sold by company 'Z' in 2022 is equal to the average number of total articles sold by company 'X' in 2018, 2020, and 2022 together and 72.72% of the total number of manufactured articles sold by company 'Z' in 2022, then what is the ratio between the number of articles that remained unsold by company 'Z' in 2022 and the number of articles that remained unsold by company 'X' in 2019 and 2021 together?

  1. AOption (a)

    11 : 26

  2. BOption (b)

    22 : 13

  3. COption (c)

    27 : 52

  4. DOption (d)

    29 : 26

  5. EOption (e)

    33 : 52

View answer & explanation

Correct answer

Answer: (a)A.

11 : 26

Explanation not yet available.

Question 145

IDBI Executive 2023• Logical Reasoning, Data Analysis & Interpretation

Directions: Answer the questions based on the information given below.

A company named 'X' has manufactured a certain number of articles over a span of five different years. The line graph provided below illustrates the number of articles sold by the company in each respective year.

Note :

(1) Total number of articles manufactured by the company in a given year = The number of articles sold + The number of articles unsold during that particular year.

(2) The number of articles sold by the company in each year amounts to 75% of the total number of articles manufactured by the company in that same year.

What is the total profit earned by the company 'X' in all the given years if the cost of each sold and unsold article in the company is 180 Rs?

  1. AOption (a)

    1080000 Rs.

  2. BOption (b)

    1260000 Rs.

  3. COption (c)

    1620000 Rs.

  4. DOption (d)

    1710000 Rs.

  5. EOption (e)

    1800000 Rs.

View answer & explanation

Correct answer

Answer: (a)A.

1080000 Rs.

Explanation not yet available.

Question 146

IDBI Executive 2023• Logical Reasoning, Data Analysis & Interpretation

Directions: Read the data carefully and answer the following questions.

The following table shows the average of three types of flowers - Tulip, Marigold, and Rose in three different parks -A, B, and C. Some of the data is missing in the following table. You have to find the missing data and answer the questions accordingly.

ParksAverage of three types of flowersRoseTulipMarigold
A480440---------
B360180---------
C280240---------

Find the total number of all three types of flower in all three parks together.

  1. AOption (a)

    2780

  2. BOption (b)

    3360

  3. COption (c)

    2960

  4. DOption (d)

    3080

  5. EOption (e)

    3280

View answer & explanation

Correct answer

Answer: (a)A.

2780

Explanation not yet available.

Question 147

IDBI Executive 2023• Logical Reasoning, Data Analysis & Interpretation

Directions: Read the data carefully and answer the following questions.

The following table shows the average of three types of flowers - Tulip, Marigold, and Rose in three different parks -A, B, and C. Some of the data is missing in the following table. You have to find the missing data and answer the questions accordingly.

ParksAverage of three types of flowersRoseTulipMarigold
A480440---------
B360180---------
C280240---------

If the ratio of Tulip and Marigold flowers in park A is 16 : 9 respectively and the difference in the number of Tulip and Marigold flowers in park B is 300, where tulip is more in number than marigold flower, then find the ratio of tulip flower in park A to the marigold flower in park B.

  1. AOption (a)

    15 : 32

  2. BOption (b)

    28 : 19

  3. COption (c)

    19 : 28

  4. DOption (d)

    32 : 15

  5. EOption (e)

    17 : 19

View answer & explanation

Correct answer

Answer: (a)A.

15 : 32

Explanation not yet available.

Question 148

IDBI Executive 2023• Logical Reasoning, Data Analysis & Interpretation

Directions: Read the data carefully and answer the following questions.

The following table shows the average of three types of flowers - Tulip, Marigold, and Rose in three different parks -A, B, and C. Some of the data is missing in the following table. You have to find the missing data and answer the questions accordingly.

ParksAverage of three types of flowersRoseTulipMarigold
A480440---------
B360180---------
C280240---------

Find the total number of Tulip and Marigold flowers in all three parks together.

  1. AOption (a)

    2200

  2. BOption (b)

    2400

  3. COption (c)

    2500

  4. DOption (d)

    2340

  5. EOption (e)

    2350

View answer & explanation

Correct answer

Answer: (a)A.

2200

Explanation not yet available.

Question 149

IDBI Executive 2023• Logical Reasoning, Data Analysis & Interpretation

Directions: Read the data carefully and answer the following questions.

The following table shows the average of three types of flowers - Tulip, Marigold, and Rose in three different parks -A, B, and C. Some of the data is missing in the following table. You have to find the missing data and answer the questions accordingly.

ParksAverage of three types of flowersRoseTulipMarigold
A480440---------
B360180---------
C280240---------

If number of Marigold flower in park B is 500, then find the number of tulip flower in park B.

  1. AOption (a)

    390

  2. BOption (b)

    250

  3. COption (c)

    450

  4. DOption (d)

    550

  5. EOption (e)

    400

View answer & explanation

Correct answer

Answer: (a)A.

390

Explanation not yet available.

Question 150

IDBI Executive 2023• Logical Reasoning, Data Analysis & Interpretation

Directions: Read the data carefully and answer the following questions.

The following table shows the average of three types of flowers - Tulip, Marigold, and Rose in three different parks -A, B, and C. Some of the data is missing in the following table. You have to find the missing data and answer the questions accordingly.

ParksAverage of three types of flowersRoseTulipMarigold
A480440---------
B360180---------
C280240---------

Find the difference between total number of Tulip and Marigold flower in park C, if the ratio of Tulip and Marigold flower in park C is 3 : 2 respectively.

  1. AOption (a)

    120

  2. BOption (b)

    140

  3. COption (c)

    180

  4. DOption (d)

    175

  5. EOption (e)

    125

View answer & explanation

Correct answer

Answer: (a)A.

120

Explanation not yet available.