Search Previous Year Questions

Find real questions from previous competitive exam papers with answers and solutions.

Leave the keyword blank to browse saved questions for your selected exam, newest papers first. Add a keyword, year or topic to narrow the results.

Browse complete papers
Showing 10 question(s)
Clear

Question 541

IDBI Assistant Manager 2021• Logical Reasoning, Data Analysis & Interpretation

Direction: Study the pie – chart carefully and answers the given questions:

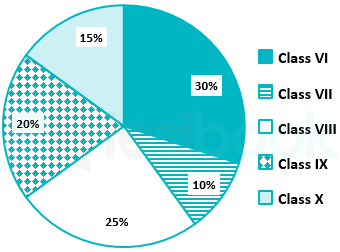
Pie chart represents the percentage of girls and boys studying in different classes in a school.

Total no. of students = 10,000

Each sector of pie-chart represents the percentage of students studying in different class.
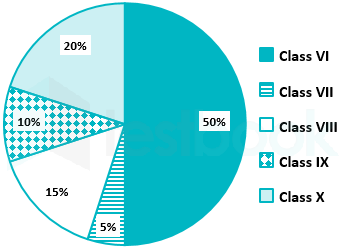
Total no. of students got promoted = 4500

Each sector represent the percentage of students  got promoted from each class.
What is the total number of students in class VI and VII together?

  1. AOption (a)

    3000

  2. BOption (b)

    4000

  3. COption (c)

    4500

  4. DOption (d)

    5000

  5. EOption (e)

    1500

View answer & explanation

Correct answer

Answer: (a)A.

3000

Explanation not yet available.
Question 542

IDBI Assistant Manager 2021• Logical Reasoning, Data Analysis & Interpretation

Direction: Study the pie – chart carefully and answers the given questions:

Pie chart represents the percentage of girls and boys studying in different classes in a school.

Total no. of students = 10,000

Each sector of pie-chart represents the percentage of students studying in different class.

Total no. of students got promoted = 4500

Each sector represent the percentage of students  got promoted from each class.

Find the average of students who got promoted from class IX, X and VI.

  1. AOption (a)

    1200

  2. BOption (b)

    1400

  3. COption (c)

    1600

  4. DOption (d)

    1800

  5. EOption (e)

    2000

View answer & explanation

Correct answer

Answer: (a)A.

1200

Explanation not yet available.

Question 543

IDBI Assistant Manager 2021• Logical Reasoning, Data Analysis & Interpretation

Direction: Study the pie – chart carefully and answers the given questions:

Pie chart represents the percentage of girls and boys studying in different classes in a school.

Total no. of students = 10,000

Each sector of pie-chart represents the percentage of students studying in different class.

Total no. of students got promoted = 4500

Each sector represent the percentage of students  got promoted from each class.

What is the ratio of promoted students from class X to class IX?

  1. AOption (a)

    2 : 1

  2. BOption (b)

    2 : 3

  3. COption (c)

    3 : 4

  4. DOption (d)

    5 : 6

  5. EOption (e)

    7 : 9

View answer & explanation

Correct answer

Answer: (a)A.

2 : 1

Explanation not yet available.

Question 544

IDBI Assistant Manager 2021• Logical Reasoning, Data Analysis & Interpretation

Direction: Study the pie – chart carefully and answers the given questions:

Pie chart represents the percentage of girls and boys studying in different classes in a school.

Total no. of students = 10,000

Each sector of pie-chart represents the percentage of students studying in different class.

Total no. of students got promoted = 4500

Each sector represent the percentage of students  got promoted from each class.

What is the ratio of the total number of students to the total number of students who do not get promoted?

  1. AOption (a)

    33 : 23

  2. BOption (b)

    20 : 11

  3. COption (c)

    11 : 67

  4. DOption (d)

    23 : 35

  5. EOption (e)

    20 : 17

View answer & explanation

Correct answer

Answer: (a)A.

33 : 23

Explanation not yet available.

Question 545

IDBI Assistant Manager 2021• Logical Reasoning, Data Analysis & Interpretation

Direction: Study the pie – chart carefully and answers the given questions:

Pie chart represents the percentage of girls and boys studying in different classes in a school.

Total no. of students = 10,000

Each sector of pie-chart represents the percentage of students studying in different class.

Total no. of students got promoted = 4500

Each sector represent the percentage of students  got promoted from each class.

The number of students who got promoted from class VI is what percent of the total number of students in that class.

  1. AOption (a)

    75%

  2. BOption (b)

    25%

  3. COption (c)

    45%

  4. DOption (d)

    65%

  5. EOption (e)

    85%

View answer & explanation

Correct answer

Answer: (a)A.

75%

Explanation not yet available.

Question 546

IDBI Assistant Manager 2021• Logical Reasoning, Data Analysis & Interpretation

Directions: Read the data carefully and answer the following questions.

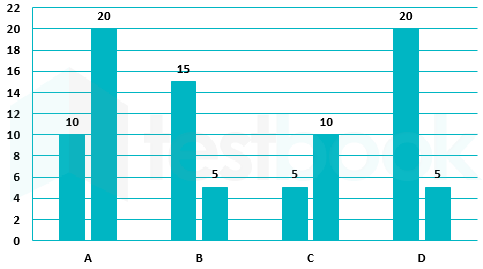
Bar graph shows that 2 successive discounts allowed on four different articles.

If the ratio of marked price of A to B is 2 ∶ 3 and difference between selling piece of both the article is 1198.65, find difference between marked prices of article A and B

  1. AOption (a)

    820

  2. BOption (b)

    1220

  3. COption (c)

    1020

  4. DOption (d)

    1100

  5. EOption (e)

    11300

View answer & explanation

Correct answer

Answer: (a)A.

820

Explanation not yet available.

Question 547

IDBI Assistant Manager 2021• Logical Reasoning, Data Analysis & Interpretation

Directions: Read the data carefully and answer the following questions.

Bar graph shows that 2 successive discounts allowed on four different articles.

Marked price of D is 20% less than that of A and sum of selling price of both the articles is 3984 and loss on D is 20% and profit on A is 20%. Find the ratio of cost price of D to that of A.

  1. AOption (a)

    15 ∶ 17

  2. BOption (b)

    17 ∶ 10

  3. COption (c)

    10 ∶ 17

  4. DOption (d)

    19 ∶ 15

  5. EOption (e)

    15 ∶ 19

View answer & explanation

Correct answer

Answer: (a)A.

15 ∶ 17

Explanation not yet available.

Question 548

IDBI Assistant Manager 2021• Logical Reasoning, Data Analysis & Interpretation

Directions: Read the data carefully and answer the following questions.

Bar graph shows that 2 successive discounts allowed on four different articles.

If the ratio of selling price of B to D is 5 ∶ 8, then find the ratio of marked price of B to D.

  1. AOption (a)

    578 ∶ 176

  2. BOption (b)

    323 ∶ 190

  3. COption (c)

    109 ∶ 177

  4. DOption (d)

    190 ∶ 323

  5. EOption (e)

    155 ∶ 190

View answer & explanation

Correct answer

Answer: (a)A.

578 ∶ 176

Explanation not yet available.

Question 549

IDBI Assistant Manager 2021• Logical Reasoning, Data Analysis & Interpretation

Directions: Read the data carefully and answer the following questions.

Bar graph shows that 2 successive discounts allowed on four different articles.

If second discount on A is increased by 20%, then the selling price of the articles decreased by 108 and selling price of C is Rs.120 less than that of A. Find the marked price of C.

  1. AOption (a)

    Rs. 2578

  2. BOption (b)

    Rs. 2456

  3. COption (c)

    Rs. 2386

  4. DOption (d)

    Rs. 1988

  5. EOption (e)

    Rs. 1476

View answer & explanation

Correct answer

Answer: (a)A.

Rs. 2578

Explanation not yet available.

Question 550

IDBI Assistant Manager 2021• Logical Reasoning, Data Analysis & Interpretation

Directions: Read the data carefully and answer the following questions.

Bar graph shows that 2 successive discounts allowed on four different articles.

Ratio of selling price of A to B is 5 ∶ 2 and sum of marked price of both the article is Rs. 61000. Find the difference between Selling price of both the articles.

  1. AOption (a)

    15,500

  2. BOption (b)

    19,480

  3. COption (c)

    45,700

  4. DOption (d)

    22,600

  5. EOption (e)

    35,710

View answer & explanation

Correct answer

Answer: (a)A.

15,500

Explanation not yet available.