Search Previous Year Questions

Find real questions from previous competitive exam papers with answers and solutions.

Leave the keyword blank to browse saved questions for your selected exam, newest papers first. Add a keyword, year or topic to narrow the results.

Browse complete papers
Showing 10 question(s)
Clear

Question 151

IDBI Assistant Manager 2022• Logical Reasoning, Data Analysis & Interpretation

Direction: Study the following Pie charts carefully and answer the questions given bellow it.

Given pie chart shows the percentage confirmed cases and deaths due to COVID – 19 in different States of India till December 2020.

Total Cases = 10 lakhs

Total deaths = 1.8 lakhs
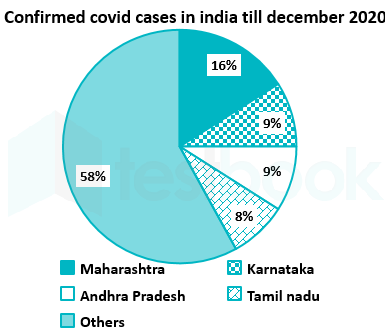
 

What percentage of patient died from COVID – 19 from Karnataka out of total case registered from the same state?

  1. AOption (a)

    38%

  2. BOption (b)

    25%

  3. COption (c)

    20%

  4. DOption (d)

    16%

  5. EOption (e)

    None of these

View answer & explanation

Correct answer

Answer: (a)A.

38%

Explanation not yet available.

Question 152

IDBI Assistant Manager 2022• Logical Reasoning, Data Analysis & Interpretation

Direction: Study the following Pie charts carefully and answer the questions given bellow it.

Given pie chart shows the percentage confirmed cases and deaths due to COVID – 19 in different States of India till December 2020.

Total Cases = 10 lakhs

Total deaths = 1.8 lakhs
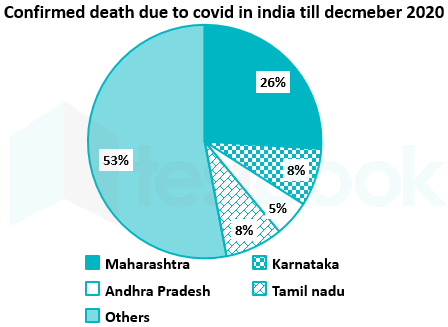
 

The number of deaths from other states exceeds the number of deaths from Maharashtra and Tamil Nadu together by

  1. AOption (a)

    34200

  2. BOption (b)

    25000

  3. COption (c)

    35000

  4. DOption (d)

    35200

  5. EOption (e)

    None of these

View answer & explanation

Correct answer

Answer: (a)A.

34200

Explanation not yet available.

Question 153

IDBI Assistant Manager 2022• Logical Reasoning, Data Analysis & Interpretation

Direction: Study the following Pie charts carefully and answer the questions given bellow it.

Given pie chart shows the percentage confirmed cases and deaths due to COVID – 19 in different States of India till December 2020.

Total Cases = 10 lakhs

Total deaths = 1.8 lakhs


What is the fraction of patients died to the patients registered for states Andhra Pradesh and Tamil Nadu together?

  1. AOption (a)

    119/950

  2. BOption (b)

    119/850

  3. COption (c)

    117/950

  4. DOption (d)

    117/850

  5. EOption (e)

    None of these

View answer & explanation

Correct answer

Answer: (a)A.

119/950

Explanation not yet available.

Question 154

IDBI Assistant Manager 2022• Logical Reasoning, Data Analysis & Interpretation

Direction: Study the following Pie charts carefully and answer the questions given bellow it.

Given pie chart shows the percentage confirmed cases and deaths due to COVID – 19 in different States of India till December 2020.

Total Cases = 10 lakhs

Total deaths = 1.8 lakhs


What is the ratio of Patients died to the Patients confirmed from Maharashtra?

  1. AOption (a)

    116 : 389

  2. BOption (b)

    123 : 419

  3. COption (c)

    115 : 397

  4. DOption (d)

    117 : 400

  5. EOption (e)

    None of these

View answer & explanation

Correct answer

Answer: (a)A.

116 : 389

Explanation not yet available.

Question 155

IDBI Assistant Manager 2022• Logical Reasoning, Data Analysis & Interpretation

Direction: Study the following Pie charts carefully and answer the questions given bellow it.

Given pie chart shows the percentage confirmed cases and deaths due to COVID – 19 in different States of India till December 2020.

Total Cases = 10 lakhs

Total deaths = 1.8 lakhs


Find the central angle of confirmed deaths in Andhra Pradesh.

  1. AOption (a)

    36° 

  2. BOption (b)

    15° 

  3. COption (c)

    20° 

  4. DOption (d)

    18° 

  5. EOption (e)

    None of these

View answer & explanation

Correct answer

Answer: (a)A.

36° 

Explanation not yet available.

Question 156

IDBI Assistant Manager 2022• Logical Reasoning, Data Analysis & Interpretation

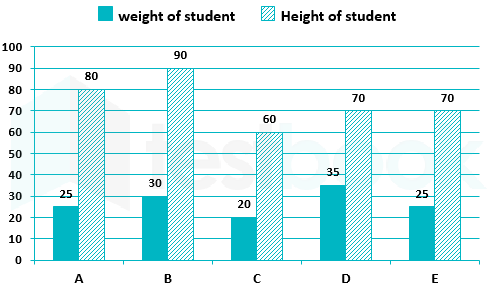
Direction: Go through the bar graph given below and answer the question based on it.

The bar graph given below represents the weight (In kg) and height (In cm) of five students (viz. A, B, C, D, and E). 


Note:

  1. The unit of height is cm and weight is in kg
  2. Formula for calculating BMI (Body mass index) = ((Weight/(height)2) × 10000 (consider values up to two decimal places)

Who amongst the following have the highest BMI?

  1. AOption (a)

    A and E

  2. BOption (b)

    A, D and E

  3. COption (c)

    B and D

  4. DOption (d)

    C and D

  5. EOption (e)

    D only

View answer & explanation

Correct answer

Answer: (a)A.

A and E

Explanation not yet available.

Question 157

IDBI Assistant Manager 2022• Logical Reasoning, Data Analysis & Interpretation

Direction: Go through the bar graph given below and answer the question based on it.

The bar graph given below represents the weight (In kg) and height (In cm) of five students (viz. A, B, C, D, and E). 


Note:

  1. The unit of height is cm and weight is in kg
  2. Formula for calculating BMI (Body mass index) = ((Weight/(height)2) × 10000 (consider values up to two decimal places)

What is the ratio of BMI of A and B if approximate values of BMI is considered?

  1. AOption (a)

    13 ∶ 18

  2. BOption (b)

    18 ∶ 13

  3. COption (c)

    39 ∶ 37

  4. DOption (d)

    37 ∶ 39

  5. EOption (e)

    9 ∶ 7

View answer & explanation

Correct answer

Answer: (a)A.

13 ∶ 18

Explanation not yet available.

Question 158

IDBI Assistant Manager 2022• Logical Reasoning, Data Analysis & Interpretation

Direction: Go through the bar graph given below and answer the question based on it.

The bar graph given below represents the weight (In kg) and height (In cm) of five students (viz. A, B, C, D, and E). 


Note:

  1. The unit of height is cm and weight is in kg
  2. Formula for calculating BMI (Body mass index) = ((Weight/(height)2) × 10000 (consider values up to two decimal places)

If the BMI is more than 52 then the student is considered as overweight. Who amongst the following is/are overweight?

  1. AOption (a)

    B and C

  2. BOption (b)

    C and D

  3. COption (c)

    D and E

  4. DOption (d)

    D only

  5. EOption (e)

    C, D and E

View answer & explanation

Correct answer

Answer: (a)A.

B and C

Explanation not yet available.

Question 159

IDBI Assistant Manager 2022• Logical Reasoning, Data Analysis & Interpretation

Direction: Go through the bar graph given below and answer the question based on it.

The bar graph given below represents the weight (In kg) and height (In cm) of five students (viz. A, B, C, D, and E). 


Note:

  1. The unit of height is cm and weight is in kg
  2. Formula for calculating BMI (Body mass index) = ((Weight/(height)2) × 10000 (consider values up to two decimal places)

The approximate BMI of C is how much parentage more than the approximate BMI of E ?

  1. AOption (a)

    9.08%

  2. BOption (b)

    10.2%

  3. COption (c)

    11.5%

  4. DOption (d)

    9.80%

  5. EOption (e)

    12.5%

View answer & explanation

Correct answer

Answer: (a)A.

9.08%

Explanation not yet available.

Question 160

IDBI Assistant Manager 2022• Logical Reasoning, Data Analysis & Interpretation

Direction: Go through the bar graph given below and answer the question based on it.

The bar graph given below represents the weight (In kg) and height (In cm) of five students (viz. A, B, C, D, and E). 


Note:

  1. The unit of height is cm and weight is in kg
  2. Formula for calculating BMI (Body mass index) = ((Weight/(height)2) × 10000 (consider values up to two decimal places)

what is average BMI of all five students if only approximate value is considered?

  1. AOption (a)

    49.5

  2. BOption (b)

    50.8

  3. COption (c)

    51.7

  4. DOption (d)

    52.5

  5. EOption (e)

    55.5

View answer & explanation

Correct answer

Answer: (a)A.

49.5

Explanation not yet available.