Directions: Read the data carefully and answer the following questions.
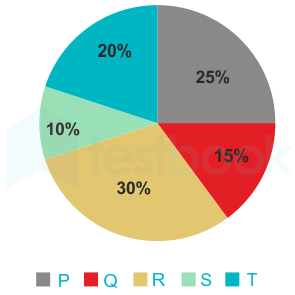
The pie chart below shows the percentage distribution of total employees (Male + Female) in a company out of 2400.
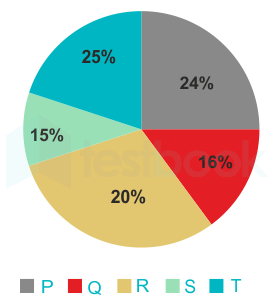
The pie chart below shows the percentage distribution of only Male employees out of 1600.
If 20% of the male employees in department T are transferred to department P and 25% of the female employees in department P are transferred to department Q, what will be the difference between the total number of male employees in department P and the total number of female employees in department Q after the transfers?
- AOption (a)
250
- BOption (b)
275
- COption (c)
300
- DOption (d)
325
- EOption (e)
306
View answer & explanationHide answer & explanation
Correct answer
Answer: (a)A.
250
Explanation not yet available.