Find the missing number in the series
35, 43, 70, 195, ?, 1869
- AOption (a)
438
- BOption (b)
540
- COption (c)
538
- DOption (d)
583
- EOption (e)
835
View answer & explanationHide answer & explanation
Correct answer
438
Find real questions from previous competitive exam papers with answers and solutions.
Leave the keyword blank to browse saved questions for your selected exam, newest papers first. Add a keyword, year or topic to narrow the results.
Browse complete papersFind the missing number in the series
35, 43, 70, 195, ?, 1869
438
540
538
583
835
Correct answer
438
Find the missing number in the series
225, 235, 205, 220, ?, 215
245
230
190
195
200
Correct answer
245
Find the missing number in the series
20, 28, 40, 60, 92, ?
48
120
108
140
148
Correct answer
48
Find the missing number in the series
0.6, 3, 15, 75, ?, 1875
275
175
375
255
345
Correct answer
275
Find the missing number in the series
8, 40, 45, 225, ?, 1150
1125
1175
230
240
250
Correct answer
1125
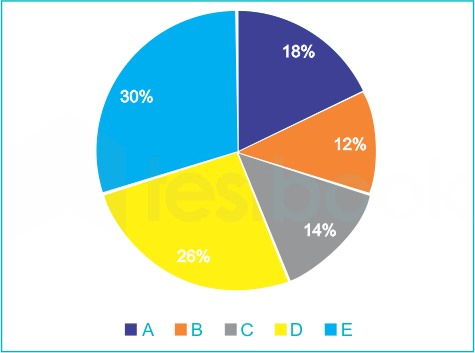
The give pie chart shows the percentage distribution of number of schools in five different cities [A, B, C, D and E].
Total value of pie chart is 6000.

Number of schools in city E is 5n. Find the value of [n/5]?
27
72
74
76
82
Correct answer
27
The give pie chart shows the percentage distribution of number of schools in five different cities [A, B, C, D and E].
Total value of pie chart is 6000.

Find the difference between total number of schools in city A and C together and total number of schools in city B and D together?
380
360
354
384
322
Correct answer
380
The give pie chart shows the percentage distribution of number of schools in five different cities [A, B, C, D and E].
Total value of pie chart is 6000.

Out of total number of school city C, 60% are private school and rest is government school. Out total government school, 25% are English medium school. Find the number of government English medium school in city C?
88
86
98
96
84
Correct answer
88
The give pie chart shows the percentage distribution of number of schools in five different cities [A, B, C, D and E].
Total value of pie chart is 6000.

Number of schools in city F is 20% more than the number of schools in city B. Difference between number of schools in city E and F is t. Find the value of 6t?
5616
5846
5966
5864
5264
Correct answer
5616
The give pie chart shows the percentage distribution of number of schools in five different cities [A, B, C, D and E].
Total value of pie chart is 6000.

Ratio of boys and girls’ school in city A is 3 : 2 and ratio of boys and girls’ school in city B is 3 : 1. Find the difference between total number of boys and total number girls’ school in city A and B together?
576
586
588
526
564
Correct answer
576