Directions: Study the following bar graph carefully and answer the questions that follow.
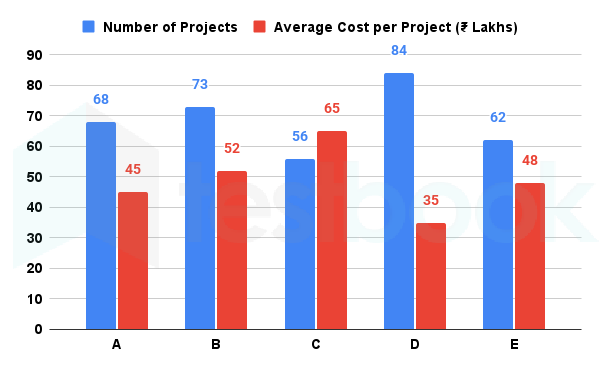
The double bar graph shows data regarding five different Managers (A, B, C, D, and E) working in an IT infrastructure company.
- The Blue Bar represents the Total Number of Projects handled by each manager.
- The Orange Bar represents the Average Cost per Project (in ₹ Lakhs) for that specific manager.
Note:
Total Cost = Number of Projects × Average Cost per Project.
A new Manager 'F' handles the same number of projects as the average number of projects handled by A and C. The Average Cost per project for F is equal to the average of the costs per project of B and D. Find the Total Cost of projects handled by Manager F.
- AOption (a)
₹2,697 Lakhs
- BOption (b)
₹2,745 Lakhs
- COption (c)
₹2,586 Lakhs
- DOption (d)
₹2,640 Lakhs
- EOption (e)
₹2,810 Lakhs
View answer & explanationHide answer & explanation
Correct answer
₹2,697 Lakhs
Why this answer is correct
General Solution:
Given:
Managers A, B, C, D, E with Number of Projects and Average Cost (₹ Lakhs):
A: 68 projects, ₹45
B: 73 projects, ₹52
C: 56 projects, ₹65
D: 84 projects, ₹35
E: 62 projects, ₹48
Total Costs:
⇒ A: 68 × 45 = 3060 (₹ Lakhs)
⇒ B: 73 × 52 = 3796 (₹ Lakhs)
⇒ C: 56 × 65 = 3640 (₹ Lakhs)
⇒ D: 84 × 35 = 2940 (₹ Lakhs)
⇒ E: 62 × 48 = 2976 (₹ Lakhs)
Calculations:
⇒ Projects_F = (68 + 56) ÷ 2 = 62
⇒ Avg cost_F = (52 + 35) ÷ 2 = 87 ÷ 2 = 43.5 (₹ Lakhs)
⇒ Total Cost_F = 62 × 43.5 = 2697 (₹ Lakhs)
Hence, the correct answer is ₹2,697 Lakhs