Search Previous Year Questions

Find real questions from previous competitive exam papers with answers and solutions.

Browse complete papers
1305 matching questions · Page 6
Clear

Question 51

IBPS Probationary Officer (PO) 2026• Quantitative Aptitude• Quantitative Aptitude

Train A of length 120 meters moving with a speed of 90 km/h cross a platform of a certain length in 40 seconds. Train B, of a certain length moving with a speed of 30 m/s crosses the same platform in 55 seconds. What will be the time taken by both trains to cross each other if both the trains are moving in the opposite direction?

  1. AOption (a)

    \(13\frac{{2;}}{{3;}}\) seconds

  2. BOption (b)

    \(23\frac{1}{4}\) seconds

  3. COption (c)

    \(16\frac{2}{{11}}\) seconds

  4. DOption (d)

    \(13\frac{1}{3}\) seconds

  5. EOption (e)

    \(15\frac{1}{{11}}\) seconds

View answer & explanation

Correct answer

Answer: (c)C.

\(16\frac{2}{{11}}\) seconds

Why this answer is correct

Given:

Length of train A = 120 meters

Speed of train = 90 km/h

Speed of train B = 30 m/s

Formula used:

Time = distance/speed

Relative speed = (sum of the length of train 1 and 2) / (sum of the speed of train 1 and 2)

Calculation:

Speed of train A = 90 × (5/18) = 25 m/s

Let the length of the platform be x meters.

⇒ (120 + x)/25 = 40

⇒ 120 + x = 1000

⇒ x = 1000 – 120

⇒ x = 880 meters

Speed of train B = 30 m/s

Let the length of train B be y meters

⇒ (y + 880)/30 = 55

⇒ y + 880 = 1650

⇒ y = 1650 – 880

⇒ y = 770 meters

∴ Required time = (120 + 770) / (25 + 30)

⇒ 890/55

⇒ \(16\frac{2}{{11}}\) seconds
Question 52

IBPS Probationary Officer (PO) 2026• Quantitative Aptitude• Quantitative Aptitude

A boat covered an upstream distance of 200 km and a downstream distance of 300 km. Time taken by boat to travel upstream distance is equal to the time taken by boat in downstream. The speed of the boat in still water is 5 km/h. Then, find the speed of the stream.

  1. AOption (a)

    1 km/h

  2. BOption (b)

    2 km/h

  3. COption (c)

    5 km/h

  4. DOption (d)

    7 km/h

  5. EOption (e)

    3 km/h

View answer & explanation

Correct answer

Answer: (a)A.

1 km/h

Why this answer is correct

Given:

Distance covered by boat in upstream = 200 km

Distance covered by boat in downstream = 300 km

Formula used:

Time = distance/speed

Calculation:

Let the speed of stream be s km/h

Upstream speed = (5 – s) km/h

Downstream speed = (5 + s) km/h

According to question:

200/(5 – s) = 300/(5 + s)

⇒ 200(5 + s) = 300(5 – s)

⇒ 1000 + 200s = 1500 – 300s

⇒ -500 = - 500s

⇒ s = 1 km/h

∴ Speed of stream is 1 km/h

Question 53

IBPS Probationary Officer (PO) 2026• Quantitative Aptitude• Quantitative Aptitude

Directions: Study the following pie chart carefully and answer the questions that follow.

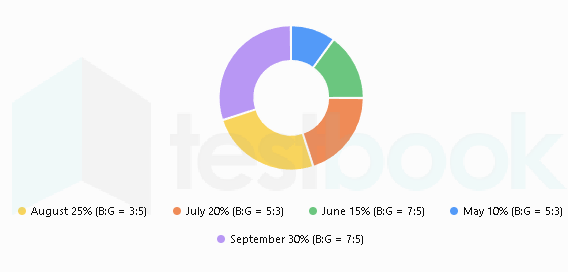
The pie chart shows the percentage distribution of the 640 balls manufactured by a company during five months—May, June, July, August and September. The figures given with each sector indicate the percentage share of total production and the ratio of Blue balls to Green balls in that month.

The total number of Blue balls manufactured during June and September together is what percent more than the total number of Green balls manufactured during May and July together?

  1. AOption (a)

    85%

  2. BOption (b)

    93 2/3%

  3. COption (c)

    133 1/3%

  4. DOption (d)

    142%

  5. EOption (e)

    145%

View answer & explanation

Correct answer

Answer: (c)C.

133 1/3%

Why this answer is correct

Common Calculation

Given:

MonthShareBlue : Green
May10%5 : 3
June15%7 : 5
July20%5 : 3
August25%3 : 5
September30%7 : 5

Total Balls Manufactured = 640

Formula:

Total Balls = Total × Percentage/100

Blue Balls = Total Balls × Blue Parts / Total Parts

Green Balls = Total Balls × Green Parts / Total Parts

Calculation:

⇒ May Total Balls = 10% of 640 = (10/100) × 640 = 64

⇒ Blue Balls in May = (5/8) × 64 = 40

⇒ Green Balls in May = (3/8) × 64 = 24

⇒ June Total Balls = 15% of 640 = (15/100) × 640 = 96

⇒ Blue Balls in June = (7/12) × 96 = 56

⇒ Green Balls in June = (5/12) × 96 = 40

⇒ July Total Balls = 20% of 640 = (20/100) × 640 = 128

⇒ Blue Balls in July = (5/8) × 128 = 80

⇒ Green Balls in July = (3/8) × 128 = 48

⇒ August Total Balls = 25% of 640 = (25/100) × 640 = 160

⇒ Blue Balls in August = (3/8) × 160 = 60

⇒ Green Balls in August = (5/8) × 160 = 100

⇒ September Total Balls = 30% of 640 = (30/100) × 640 = 192

⇒ Blue Balls in September = (7/12) × 192 = 112

⇒ Green Balls in September = (5/12) × 192 = 80

Given:

Blue Balls (June) = 56

Blue Balls (September) = 112

Green Balls (May) = 24

Green Balls (July) = 48

Formula:

Required Percentage

= [(First Quantity − Second Quantity)/Second Quantity] × 100

Calculation:

⇒ Total Blue Balls (June & September) = 56 + 112 = 168

⇒ Total Green Balls (May & July) = 24 + 48 = 72

⇒ Difference = 168 – 72 = 96

⇒ Required Percentage = (96/72) × 100 = 133(1/3)%

∴ Answer = 133(1/3)%

Question 54

IBPS Probationary Officer (PO) 2026• Quantitative Aptitude• Quantitative Aptitude

Directions: Study the following pie chart carefully and answer the questions that follow.

The pie chart shows the percentage distribution of the 640 balls manufactured by a company during five months—May, June, July, August and September. The figures given with each sector indicate the percentage share of total production and the ratio of Blue balls to Green balls in that month.

What is the ratio of the total number of Green balls manufactured during August and September together to the total number of Blue balls manufactured during May, June and July together?

  1. AOption (a)

    45:41

  2. BOption (b)

    45:42

  3. COption (c)

    7:6

  4. DOption (d)

    13:12

  5. EOption (e)

    33:32

View answer & explanation

Correct answer

Answer: (b)B.

45:42

Why this answer is correct

Common Calculation

Given:

MonthShareBlue : Green
May10%5 : 3
June15%7 : 5
July20%5 : 3
August25%3 : 5
September30%7 : 5

Total Balls Manufactured = 640

Formula:

Total Balls = Total × Percentage/100

Blue Balls = Total Balls × Blue Parts / Total Parts

Green Balls = Total Balls × Green Parts / Total Parts

Calculation:

⇒ May Total Balls = 10% of 640 = (10/100) × 640 = 64

⇒ Blue Balls in May = (5/8) × 64 = 40

⇒ Green Balls in May = (3/8) × 64 = 24

⇒ June Total Balls = 15% of 640 = (15/100) × 640 = 96

⇒ Blue Balls in June = (7/12) × 96 = 56

⇒ Green Balls in June = (5/12) × 96 = 40

⇒ July Total Balls = 20% of 640 = (20/100) × 640 = 128

⇒ Blue Balls in July = (5/8) × 128 = 80

⇒ Green Balls in July = (3/8) × 128 = 48

⇒ August Total Balls = 25% of 640 = (25/100) × 640 = 160

⇒ Blue Balls in August = (3/8) × 160 = 60

⇒ Green Balls in August = (5/8) × 160 = 100

⇒ September Total Balls = 30% of 640 = (30/100) × 640 = 192

⇒ Blue Balls in September = (7/12) × 192 = 112

⇒ Green Balls in September = (5/12) × 192 = 80

Given:

Green Balls (August & September)

Blue Balls (May, June & July)

Formula:

Required Ratio

= First Quantity : Second Quantity

Calculation:

⇒ Green Balls in August and September = 100 + 80 = 180

⇒ Blue Balls in May, June and July = 40 + 56 + 80 = 176

⇒ Required Ratio = 180 : 176 = 45 : 44

∴ Answer = 45 : 44

Question 55

IBPS Probationary Officer (PO) 2026• Quantitative Aptitude• Quantitative Aptitude

Directions: Study the following pie chart carefully and answer the questions that follow.

The pie chart shows the percentage distribution of the 640 balls manufactured by a company during five months—May, June, July, August and September. The figures given with each sector indicate the percentage share of total production and the ratio of Blue balls to Green balls in that month.

If 20 Blue balls are transferred from September to August, then what will be the ratio of Blue balls in August to Blue balls in September?

  1. AOption (a)

    4:5

  2. BOption (b)

    5:7

  3. COption (c)

    9:11

  4. DOption (d)

    13:16

  5. EOption (e)

    20:23

View answer & explanation

Correct answer

Answer: (e)E.

20:23

Why this answer is correct

Common Calculation

Given:

MonthShareBlue : Green
May10%5 : 3
June15%7 : 5
July20%5 : 3
August25%3 : 5
September30%7 : 5

Total Balls Manufactured = 640

Formula:

Total Balls = Total × Percentage/100

Blue Balls = Total Balls × Blue Parts / Total Parts

Green Balls = Total Balls × Green Parts / Total Parts

Calculation:

⇒ May Total Balls = 10% of 640 = (10/100) × 640 = 64

⇒ Blue Balls in May = (5/8) × 64 = 40

⇒ Green Balls in May = (3/8) × 64 = 24

⇒ June Total Balls = 15% of 640 = (15/100) × 640 = 96

⇒ Blue Balls in June = (7/12) × 96 = 56

⇒ Green Balls in June = (5/12) × 96 = 40

⇒ July Total Balls = 20% of 640 = (20/100) × 640 = 128

⇒ Blue Balls in July = (5/8) × 128 = 80

⇒ Green Balls in July = (3/8) × 128 = 48

⇒ August Total Balls = 25% of 640 = (25/100) × 640 = 160

⇒ Blue Balls in August = (3/8) × 160 = 60

⇒ Green Balls in August = (5/8) × 160 = 100

⇒ September Total Balls = 30% of 640 = (30/100) × 640 = 192

⇒ Blue Balls in September = (7/12) × 192 = 112

⇒ Green Balls in September = (5/12) × 192 = 80


Given:

Blue Balls in August = 60

Blue Balls in September = 112

Transferred Blue Balls = 20

Formula:

New Quantity

= Original Quantity ± Transferred Balls

Required Ratio

= New Blue Balls in August : New Blue Balls in September

Calculation:

⇒ New Blue Balls in August = 60 + 20 = 80

⇒ New Blue Balls in September = 112 – 20 = 92

⇒ Required Ratio = 80 : 92 = 20 : 23

∴ Answer = 20 : 23

Question 56

IBPS Probationary Officer (PO) 2026• Quantitative Aptitude• Quantitative Aptitude

Directions: Study the following pie chart carefully and answer the questions that follow.

The pie chart shows the percentage distribution of the 640 balls manufactured by a company during five months—May, June, July, August and September. The figures given with each sector indicate the percentage share of total production and the ratio of Blue balls to Green balls in that month.

The average number of balls manufactured during June, July and August is how much more than the average number of balls manufactured during May and September?

  1. AOption (a)

    5

  2. BOption (b)

    0

  3. COption (c)

    8

  4. DOption (d)

    6

  5. EOption (e)

    10

View answer & explanation

Correct answer

Answer: (b)B.

0

Why this answer is correct

Common Calculation

Given:

MonthShareBlue : Green
May10%5 : 3
June15%7 : 5
July20%5 : 3
August25%3 : 5
September30%7 : 5

Total Balls Manufactured = 640

Formula:

Total Balls = Total × Percentage/100

Blue Balls = Total Balls × Blue Parts / Total Parts

Green Balls = Total Balls × Green Parts / Total Parts

Calculation:

⇒ May Total Balls = 10% of 640 = (10/100) × 640 = 64

⇒ Blue Balls in May = (5/8) × 64 = 40

⇒ Green Balls in May = (3/8) × 64 = 24

⇒ June Total Balls = 15% of 640 = (15/100) × 640 = 96

⇒ Blue Balls in June = (7/12) × 96 = 56

⇒ Green Balls in June = (5/12) × 96 = 40

⇒ July Total Balls = 20% of 640 = (20/100) × 640 = 128

⇒ Blue Balls in July = (5/8) × 128 = 80

⇒ Green Balls in July = (3/8) × 128 = 48

⇒ August Total Balls = 25% of 640 = (25/100) × 640 = 160

⇒ Blue Balls in August = (3/8) × 160 = 60

⇒ Green Balls in August = (5/8) × 160 = 100

⇒ September Total Balls = 30% of 640 = (30/100) × 640 = 192

⇒ Blue Balls in September = (7/12) × 192 = 112

⇒ Green Balls in September = (5/12) × 192 = 80


Given:

Balls Manufactured during June, July and August

Balls Manufactured during May and September

Formula:

Average

= Sum of Quantities/Number of Quantities

Required Difference

= First Average − Second Average

Calculation:

⇒ Average Balls Manufactured during June, July and August = (96 + 128 + 160)/3 = 384/3 = 128

⇒ Average Balls Manufactured during May and September = (64 + 192)/2 = 256/2 = 128

⇒ Required Difference = 128 – 128 = 0

∴ Answer = 0

Question 57

IBPS Probationary Officer (PO) 2026• Quantitative Aptitude• Quantitative Aptitude

Directions: Study the following pie chart carefully and answer the questions that follow.

The pie chart shows the percentage distribution of the 640 balls manufactured by a company during five months—May, June, July, August and September. The figures given with each sector indicate the percentage share of total production and the ratio of Blue balls to Green balls in that month.

Green balls manufactured during August are what percent of the total Blue balls manufactured during June and July together?

  1. AOption (a)

    73.5%

  2. BOption (b)

    76%

  3. COption (c)

    67.5%

  4. DOption (d)

    65%

  5. EOption (e)

    70%

View answer & explanation

Correct answer

Answer: (a)A.

73.5%

Why this answer is correct

Common Calculation

Given:

MonthShareBlue : Green
May10%5 : 3
June15%7 : 5
July20%5 : 3
August25%3 : 5
September30%7 : 5

Total Balls Manufactured = 640

Formula:

Total Balls = Total × Percentage/100

Blue Balls = Total Balls × Blue Parts / Total Parts

Green Balls = Total Balls × Green Parts / Total Parts

Calculation:

⇒ May Total Balls = 10% of 640 = (10/100) × 640 = 64

⇒ Blue Balls in May = (5/8) × 64 = 40

⇒ Green Balls in May = (3/8) × 64 = 24

⇒ June Total Balls = 15% of 640 = (15/100) × 640 = 96

⇒ Blue Balls in June = (7/12) × 96 = 56

⇒ Green Balls in June = (5/12) × 96 = 40

⇒ July Total Balls = 20% of 640 = (20/100) × 640 = 128

⇒ Blue Balls in July = (5/8) × 128 = 80

⇒ Green Balls in July = (3/8) × 128 = 48

⇒ August Total Balls = 25% of 640 = (25/100) × 640 = 160

⇒ Blue Balls in August = (3/8) × 160 = 60

⇒ Green Balls in August = (5/8) × 160 = 100

⇒ September Total Balls = 30% of 640 = (30/100) × 640 = 192

⇒ Blue Balls in September = (7/12) × 192 = 112

⇒ Green Balls in September = (5/12) × 192 = 80

Given:

Green Balls in August = 100

Blue Balls in June = 56

Blue Balls in July = 80

Formula:

Required Percentage

= (Required Quantity/Base Quantity) × 100

Calculation:

⇒ Total Blue Balls in June and July = 56 + 80 = 136

⇒ Green Balls in August = 100

⇒ Required Percentage = (100/136) × 100 = 73.53% ≈ 73.5%

∴ Answer = 73.5%

Question 58

IBPS Probationary Officer (PO) 2026• Quantitative Aptitude• Quantitative Aptitude

The population of the village is x and 2/7th of them are graduates and from the remaining are non graduates. If 30% of non graduates is  2100.The 25% of the graduates are employed and 42.85% of the non - graduates are unemployed. Find the difference between unemployed graduates and employed non - graduates.

  1. AOption (a)

    1800

  2. BOption (b)

    2200

  3. COption (c)

    2300

  4. DOption (d)

    2100

  5. EOption (e)

    1900

View answer & explanation

Correct answer

Answer: (e)E.

1900

Why this answer is correct

Given:

Total population of the village = x

2/7 of them are graduates

Remaining are non-graduates

30% of non-graduates = 2100

25% of graduates are employed

42.85% of non-graduates are unemployed

Formula used:

Number of non-graduates = Total population - Number of graduates

Number of unemployed graduates = 75% of graduates

Number of employed non-graduates = 57.15% of non-graduates

Calculations:

Let the total population be x.

Number of graduates:

2/7 of x = 2x/7

Number of non-graduates:

Remaining = x - 2x/7 = 5x/7

Given 30% of non-graduates = 2100:

0.3 × 5x/7 = 2100

⇒ 1.5x/7 = 2100

⇒ 1.5x = 2100 × 7

⇒ 1.5x = 14700

⇒ x = 14700 / 1.5

⇒ x = 9800

Total population = 9800

Number of graduates:

2/7 of 9800 = 2/7 × 9800 = 2800

Number of non-graduates:

5/7 of 9800 = 5/7 × 9800 = 7000

Number of employed graduates:

25% of 2800 = 0.25 × 2800 = 700

Number of unemployed graduates:

75% of 2800 = 0.75 × 2800 = 2100

Number of unemployed non-graduates:

42.85% of 7000 = 0.4285 × 7000 = 2999.5 ≈ 3000

Number of employed non-graduates:

Remaining non-graduates after accounting for unemployed non-graduates:

Total non-graduates - Unemployed non-graduates = 7000 - 3000 = 4000

Difference between unemployed graduates and employed non-graduates:

Difference = 2100 - 4000

∴ The difference between unemployed graduates and employed non-graduates is 1900.

Question 59

IBPS Probationary Officer (PO) 2026• Quantitative Aptitude• Quantitative Aptitude

There is a group of dogs playing in a pet house. Their average weight is 9.5 kg. If 5 dogs with an average weight of 6.5 kg leave the group by getting exhausted and 4 dogs of average weight 12.5 kg join the group, the average of the group increases by 3 kg. How many dogs were there in the group initially?

  1. AOption (a)

    12

  2. BOption (b)

    17

  3. COption (c)

    11

  4. DOption (d)

    7

  5. EOption (e)

    10

View answer & explanation

Correct answer

Answer: (e)E.

10

Why this answer is correct

Given:

Average weight initially = 9.5 kg

5 dogs with average weight 6.5 kg leave and 4 dogs with average weight 12.5 kg join the group

Average increases by 3 kg

Formula used:

Average = sum of observations / no. of observations

Calculation:

Let the no. of dogs be x

According to question,

(9.5x - 5 × 6.5 + 4 × 12.5) / x - 5 + 4 = 12.5

⇒ (9.5x - 32.5 + 50) / x- 1 = 12.5

⇒ 9.5x + 17.5 / x - 1 = 12.5

⇒ 9.5x + 17.5 = (x - 1) × 12.5

⇒ 12.5x - 9.5x = 17.5 + 12.5

⇒ 3x = 30

⇒ x = 10

∴ The number of dogs initially in the group is 10.

Question 60

IBPS Probationary Officer (PO) 2026• Quantitative Aptitude• Quantitative Aptitude

A and B started a business by investing amounts in the ratio 4:5, respectively. After 7 months, C joined the business by investing ₹18,000. At the end of one year, the profit earned by A, B and C was distributed in the ratio 8: 10: 5, respectively. Find the amount invested by B. 

  1. AOption (a)

    ₹12,000

  2. BOption (b)

    ₹15,000

  3. COption (c)

    ₹18,000

  4. DOption (d)

    ₹20,000

  5. EOption (e)

    ₹24,000

View answer & explanation

Correct answer

Answer: (b)B.

₹15,000

Why this answer is correct

Let the investments of A and B be ₹4x and ₹5x, respectively.

A and B invested their amounts for 12 months, while C invested for 12 – 7 = 5 months

Ratio of profits = 4x × 12: 5x × 12: 18000 × 5 = 48x:60x:90000

Given profit ratio = 8:10:5

Therefore, 48x/8 = 90000/5

Or, 6x = 18000

So, x = 3000

Investment of B = 5x = 5 × 3000 = ₹ 15,000