Search Previous Year Questions

Find real questions from previous competitive exam papers with answers and solutions.

Leave the keyword blank to browse saved questions for your selected exam, newest papers first. Add a keyword, year or topic to narrow the results.

Browse complete papers
Showing 10 question(s)
Clear

Question 191

Combined Defence Services (CDS) 2025• Elementary Mathematics

The frequency distribution of marks obtained by students in an English examination is given below:

Marks obtainedNumber of Students
Below 4050
Below 50125
Below 60210
Below 70315
Below 80350

What is the number of students who scored between 60 and 70 marks?

  1. AOption (a)

    105

  2. BOption (b)

    110

  3. COption (c)

    205

  4. DOption (d)

    210

View answer & explanation

Correct answer

Answer: (a)A.

105

Why this answer is correct

Given:

Cumulative frequency distribution of marks:

Below 40 = 50

Below 50 = 125

Below 60 = 210

Below 70 = 315

Below 80 = 350

Formula used:

Number of students in a class = Cumulative frequency of upper limit - Cumulative frequency of lower limit

Calculations:

Students between 60 and 70 = 315 - 210 = 105

∴ The number of students who scored between 60 and 70 marks is 105.
Question 192

Combined Defence Services (CDS) 2025• Elementary Mathematics

The frequency distribution of marks obtained by students in an English examination is given below:

Marks obtainedNumber of Students
Below 4050
Below 50125
Below 60210
Below 70315
Below 80350

What is the number of students who scored more than 50 marks?

  1. AOption (a)

    100

  2. BOption (b)

    125

  3. COption (c)

    200

  4. DOption (d)

    225

View answer & explanation

Correct answer

Answer: (d)D.

225

Why this answer is correct

Given:

Cumulative frequency distribution of marks:

Below 40 = 50

Below 50 = 125

Below 60 = 210

Below 70 = 315

Below 80 = 350

Formula used:

Number of students scoring more than a mark = Total students - Cumulative frequency of that mark

Calculations:

Total students = 350 (Below 80)

Students scoring more than 50 = 350 - 125 = 225

∴ The number of students who scored more than 50 marks is 225.

Question 193

Combined Defence Services (CDS) 2025• Elementary Mathematics

Circulation figures (in thousands) of different newspapers (A, B, C, D, E) for five years are given below:

YearABCDE
2019201015820
20201212181212
20212414171415
2022261016159
20232216141611

In which of the given years was the circulation of the newspaper D close to its average circulation over all the years?

  1. AOption (a)

    2020 and 2021

  2. BOption (b)

    2022 and 2023

  3. COption (c)

    2022 only

  4. DOption (d)

    2020 only

View answer & explanation

Correct answer

Answer: (a)A.

2020 and 2021

Why this answer is correct

Calculations:

Sum of D = 8 + 12 + 14 + 15 + 16 = 65 (thousands)

Average of D = 65 ÷ 5 = 13 (thousands)

Differences from average:

2019: |8 − 13| = 5

2020: |12 − 13| = 1

2021: |14 − 13| = 1

2022: |15 − 13| = 2

2023: |16 − 13| = 3

∴ The circulation of D was closest to its average (13 thousands) in the years 2020 and 2021 (difference = 1 thousand).

Question 194

Combined Defence Services (CDS) 2025• Elementary Mathematics

Circulation figures (in thousands) of different newspapers (A, B, C, D, E) for five years are given below:

YearABCDE
2019201015820
20201212181212
20212414171415
2022261016159
20232216141611

In which of the years from 2019 to 2022 was the circulation of the newspaper D close to the average circulation of all the newspapers in that year?

  1. AOption (a)

    2019

  2. BOption (b)

    2020

  3. COption (c)

    2021

  4. DOption (d)

    2022

View answer & explanation

Correct answer

Answer: (d)D.

2022

Why this answer is correct

Given:

Circulation figures (in thousands) for newspapers A, B, C, D, E from 2019 to 2022

Formula used:

Average circulation = (A + B + C + D + E) ÷ 5

Calculations:

2019: Total = 20 + 10 + 15 + 8 + 20 = 73

Average = 73 ÷ 5 = 14.6; D = 8 → Difference = 6.6

2020: Total = 12 + 12 + 18 + 12 + 12 = 66

Average = 66 ÷ 5 = 13.2; D = 12 → Difference = 1.2

2021: Total = 24 + 14 + 17 + 14 + 15 = 84

Average = 84 ÷ 5 = 16.8; D = 14 → Difference = 2.8

2022: Total = 26 + 10 + 16 + 15 + 9 = 76

Average = 76 ÷ 5 = 15.2; D = 15 → Difference = 0.2

∴ The circulation of newspaper D was closest to the average in 2022.

Question 195

Combined Defence Services (CDS) 2025• Elementary Mathematics

Circulation figures (in thousands) of different newspapers (A, B, C, D, E) for five years are given below:

YearABCDE
2019201015820
20201212181212
20212414171415
2022261016159
20232216141611

How many cases are there in which average of the circulation for an individual newspaper was more than the average of the circulation of all the newspapers?

  1. AOption (a)

    One

  2. BOption (b)

    Two

  3. COption (c)

    Three

  4. DOption (d)

    Four

View answer & explanation

Correct answer

Answer: (b)B.

Two

Why this answer is correct

Given:

Circulation figures (in thousands) of newspapers A, B, C, D, E for years 2019–2023

Formula used:

Average for individual newspaper = Sum of its circulation ÷ 5

Average of all newspapers for all years = Total circulation of all newspapers ÷ (5 × 5)

Calculations:

Total circulation for each newspaper:

A = 20 + 12 + 24 + 26 + 22 = 104 → Average = 104 ÷ 5 = 20.8

B = 10 + 12 + 14 + 10 + 16 = 62 → Average = 62 ÷ 5 = 12.4

C = 15 + 18 + 17 + 16 + 14 = 80 → Average = 80 ÷ 5 = 16

D = 8 + 12 + 14 + 15 + 16 = 65 → Average = 65 ÷ 5 = 13

E = 20 + 12 + 15 + 9 + 11 = 67 → Average = 67 ÷ 5 = 13.4

Total circulation of all newspapers = 104 + 62 + 80 + 65 + 67 = 378

Average circulation of all newspapers = 378 ÷ 25 = 15.12

Compare individual averages with 15.12:

A = 20.8 > 15.12 ✅

B = 12.4 < 15.12 ❌

C = 16 > 15.12 ✅

D = 13 < 15.12 ❌

E = 13.4 < 15.12 ❌

∴ There are 2 newspapers (A and C) whose average circulation is more than the average of all newspapers.

Question 196

Combined Defence Services (CDS) 2025• Elementary Mathematics

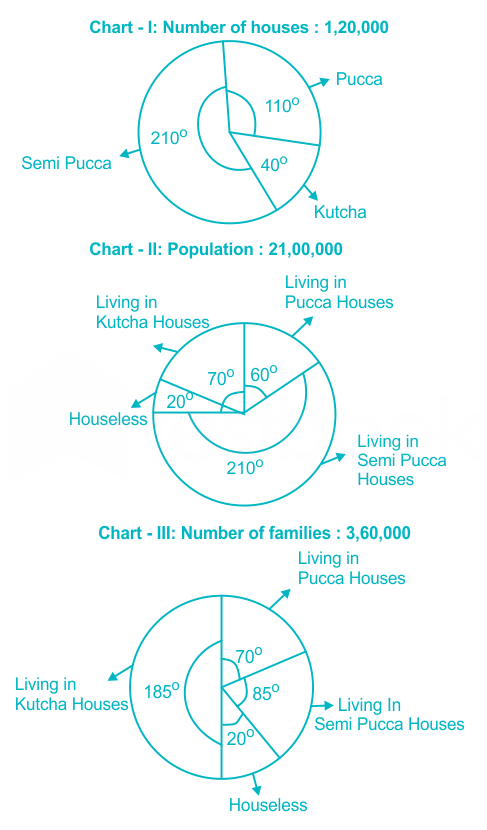
Study the following Pie Charts:


On an average, how many persons live in every pucca house?

  1. AOption (a)

    8

  2. BOption (b)

    8·54

  3. COption (c)

    9·54

  4. DOption (d)

    7·54

View answer & explanation

Correct answer

Answer: (c)C.

9·54

Why this answer is correct

Given:

From Chart-I: Number of houses = 1,20,000

Angle for Pucca houses = 110°

From Chart-II: Population = 21,00,000

Angle for population living in Pucca houses = 60°

Formula used:

Part of total = (Angle / 360) × Total Value

Average = Total Value / Number of units

Calculations:

Number of Pucca Houses = (110 / 360) × 1,20,000

⇒ Number of Pucca Houses = (11 / 36) × 1,20,000

⇒ Number of Pucca Houses = 11 × (120000 / 36)

⇒ Number of Pucca Houses = 110000 / 3

Population Living in Pucca Houses = (60 / 360) × 21,00,000

⇒ Population Living in Pucca Houses = (1 / 6) × 21,00,000

⇒ Population Living in Pucca Houses = 3,50,000

Average Persons per Pucca House = Population Living in Pucca Houses / Number of Pucca Houses

⇒ Average Persons per Pucca House = 350000 / (110000 / 3)

⇒ Average Persons per Pucca House = (350000 × 3) / 110000

⇒ Average Persons per Pucca House = (35 × 3) / 11

⇒ Average Persons per Pucca House = 105 / 11

⇒ Average Persons per Pucca House ≈ 9.5454...

∴ The correct answer is option 3.

Question 197

Combined Defence Services (CDS) 2025• Elementary Mathematics

Study the following Pie Charts:


If 5000 more Kutcha houses are built, then what will be approximate change in angle for Kutcha houses in Pie Chart-I?

  1. AOption (a)

    11°

  2. BOption (b)

    13°

  3. COption (c)

    15°

  4. DOption (d)

    23°

View answer & explanation

Correct answer

Answer: (b)B.

13°

Why this answer is correct

Given:

From Chart-I: Initial total number of houses = 1,20,000

Initial angle for Kutcha houses = 40°

Increase in Kutcha houses = 5000

Formula used:

Number of houses for a category = (Angle for category / 360°) × Total number of houses

Angle for a category = (Number of houses for category / Total number of houses) × 360°

Calculations:

Initial number of Kutcha houses = (40 / 360) × 1,20,000

⇒ Initial number of Kutcha houses = (1 / 9) × 1,20,000

⇒ Initial number of Kutcha houses = 120000 / 9

New total number of houses = Initial total number of houses + 5000

⇒ New total number of houses = 1,20,000 + 5000

⇒ New total number of houses = 1,25,000

New number of Kutcha houses = Initial number of Kutcha houses + 5000

⇒ New number of Kutcha houses = (120000 / 9) + 5000

⇒ New number of Kutcha houses = (120000 + 45000) / 9

⇒ New number of Kutcha houses = 165000 / 9

New angle for Kutcha houses = (New number of Kutcha houses / New total number of houses) × 360°

⇒ New angle for Kutcha houses = ((165000 / 9) / 125000) × 360°

⇒ (165000 / (9 × 125000)) × 360°

⇒ (165 / (9 × 125)) × 360°

⇒ (11 / 75) × 360° = 11 × 4.8 = 52.8°

Change in angle = New angle for Kutcha houses - Initial angle for Kutcha houses

⇒ Change in angle = 52.8° - 40°

⇒ Change in angle = 12.8° ≈ 13° 

∴ The approximate change in angle for Kutcha houses in Pie Chart-I will be 12.8°.

Question 198

Combined Defence Services (CDS) 2025• Elementary Mathematics

Study the following Pie Charts:


If 300 families from the "Houseless" category shift into Kutcha houses, what will be the average number of families in every Kutcha house?

  1. AOption (a)

    15

  2. BOption (b)

    13.9

  3. COption (c)

    12.9

  4. DOption (d)

    10.5

View answer & explanation

Correct answer

Answer: (b)B.

13.9

Why this answer is correct

Given:

From Chart-III: Total number of families = 3,60,000

Angle for families in "Houseless" category = 20°

Angle for families "Living in Kutcha houses" = 185°

Number of families from "Houseless" category shifting to Kutcha houses = 300

Formula used:

Number of families for a category = (Angle for category / 360°) × Total number of families

Average families per house = Total families in houses / Total number of houses of that type

Calculations:

Initial Families in Kutcha Houses = (185 / 360) × 3,60,000

⇒ Initial Families in Kutcha Houses = 185 × (3,60,000 / 360) = 1,85,000

Initial Houseless Families = (20 / 360) × 3,60,000

⇒ Initial Houseless Families = 20 × (3,60,000 / 360) = 20,000

New Families in Kutcha Houses = Initial Families in Kutcha Houses + 300

⇒ New Families in Kutcha Houses = 1,85,000 + 300 = 1,85,300

From previous calculations or Chart-I:

Number of Kutcha Houses = (40 / 360) × 1,20,000

⇒ Number of Kutcha Houses = 120000 / 9

Average families per Kutcha house = New Families in Kutcha Houses / Number of Kutcha Houses

⇒ Average families per Kutcha house = 1,85,300 / (120000 / 9)

⇒ Average families per Kutcha house = (1,85,300 × 9) / 120000

⇒ Average families per Kutcha house = 1667700 / 120000

⇒ Average families per Kutcha house = 16677 / 1200

⇒ Average families per Kutcha house ≈ 13.8975 ≈ 13.9

∴ The average number of families in every Kutcha house will be 13.90.

Question 199

Combined Defence Services (CDS) 2025• Elementary Mathematics

Marks obtained by 60 students in a test (Maximum Marks-100) are given below :

60, 82, 63, 40, 88, 80, 24, 60, 09, 58, 44, 74 57, 60, 63, 30, 31, 64, 00, 62, 37, 54, 10, 99 35, 83, 58, 33, 92, 43, 66, 41, 78, 72, 32, 33 65, 11, 60, 17, 53, 93, 57, 03, 29, 31, 82, 50 63, 15, 41, 55, 72, 42, 32, 23, 30, 48, 67, 34

What is the percentage (approximate) of students getting marks higher than or equal to 60 but less than 80 ?

  1. AOption (a)

    25.0

  2. BOption (b)

    26.7

  3. COption (c)

    28.3

  4. DOption (d)

    30.0

View answer & explanation

Correct answer

Answer: (b)B.

26.7

Why this answer is correct

Given:

Total students = 60

Marks range considered = ≥ 60 and < 80

Calculations:

Number of students in the range = 16

Percentage = (16 ÷ 60) × 100

⇒ Percentage = 26.67% ≈ 26.7%

∴ Approximately 26.7% of students scored between 60 and 79 marks.

Question 200

Combined Defence Services (CDS) 2025• Elementary Mathematics

The arithmetic mean of 100 observations was 50. Later on, it was found that two observations were misread as 82 and 6 instead of 182 and 56. What is the value of the corrected mean?

  1. AOption (a)

    50.1

  2. BOption (b)

    51.5

  3. COption (c)

    52.3

  4. DOption (d)

    53.4

View answer & explanation

Correct answer

Answer: (b)B.

51.5

Why this answer is correct

Given:

Initial arithmetic mean of 100 observations = 50

Misread observations = 82 and 6

Correct observations = 182 and 56

Formula used:

Mean = (Sum of all observations) ÷ (Number of observations)

Calculations:

Initial sum of observations = Mean × Number of observations = 50 × 100 = 5000

Difference in sum due to misread observations = (182 + 56) - (82 + 6) = 238 - 88 = 150

Corrected sum of observations = 5000 + 150 = 5150

Corrected mean = Corrected sum ÷ Number of observations = 5150 ÷ 100 = 51.5

∴ The corrected mean is 51.5