Directions: Study the following information carefully and answer the questions.
The bar graph below presents the number of units produced by Company Y over five consecutive years, from 2010 to 2014.
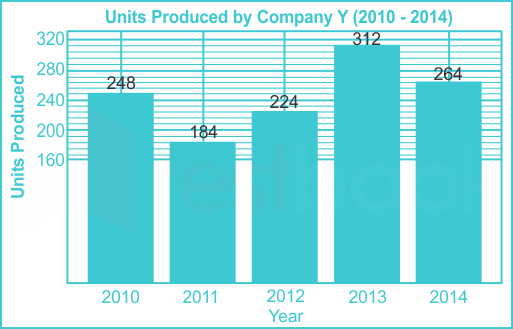
What is the ratio of the total units produced in 2010 and 2012 to the total units produced in 2011 and 2014?
- AOption (a)
59:56
- BOption (b)
29:28
- COption (c)
47:44
- DOption (d)
31:28
- EOption (e)
65:28
View answer & explanationHide answer & explanation
Correct answer
Answer: (a)A.
59:56
Explanation not yet available.