Concept:
For solving this question, you should have clear idea of T-S and p-h diagram, for vapour compression refrigeration cycle.
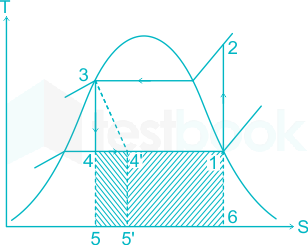
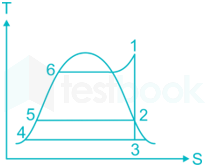
Figure: Cycle 1-2-3-4’-1; Ideal vapour compression refrigeration cycle (T-S plot)
Processes
1-2: Isentropic compression
2-3: Heat rejection
3-4: Isentropic expansion
3-4’: Isenthalpic expansion (Irreversible process)
4-1: Evaporation (Heat absorption)
We know that area under any process in T-S plot represents heat interaction
i.e. \({Q_{1 - 2}} = \mathop \smallint \nolimits_1^2 TdS\)
When expansion process is isenthalpic (3-4’), heat absorption (refrigeration effect) is represented by area 4’-5’-6-1.
When expansion process is isentropic (3-4), refrigeration effect is represented by area 4-5-6-1.
COP=Work;inputRefrigeration;effect=WRE …1)
Since, work input for both cycles is same (Process 1-2).
Area (4-5-6-1) > Area (4’-5’-6-1)
⇒ RE (Isentropic expansion) > RE (Isenthalpic expansion)
⇒ COP (isentropic expansion) > COP (isenthalpic expansion), {From 1)}
So, option 1) is correct
This can also be proved by drawing p-h chart
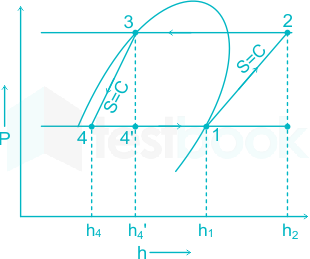
Figure: Pressure – enthalpy (p-h) chart for ideal VCR cycle
1-2: Isentropic compression
2-3: Heat rejection
3-4’: Isenthalpic expansion
3-4: Isentropic expansion
4-1: Heat addition (Evaporation)
COP=WRE
For original cycle: (Isenthalpic expansion:3-4’)
RE=h1−h4′,;W=h2−h1⇒COP∣original=h2−h1h1−h4′ …3)
For modified cycle: (Isentropic expansion) (3-4)
RE=h1−h4,;W=h2−h1⇒COP∣Modified=h2−h1h1−h4 …4)
\(\frac{{{{\left. {COP} \right|}{Modified}}}}{{{{\left. {COP} \right|}{Original}}}} = \frac{{{h_1} - {h_4}}}{{{h_1} - h_4'}} > 1\) {∵ h1 – h4 > h1 – h4’}
\(\Rightarrow {\left. {COP} \right|{Modified}} > {\left. {COP} \right|{Original}}\)
Key Points:
Remember T-S and p-h plot for vapour compression refrigeration cycle. Also understand the nature of constant entropy lines in p-h chart. Study the effect of various parameters like evaporator pressure, condenser pressure on COP.