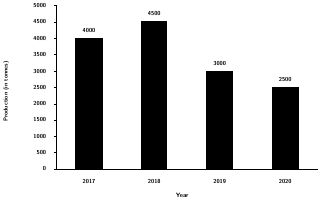
In the following graph the production of raggi in 4 consecutive years are plotted. In which year the production of raggi is minimum?
- AOption (a)
2020
- BOption (b)
2017
- COption (c)
2019
- DOption (d)
2018
View answer & explanationHide answer & explanation
Correct answer
Answer: (a)A.
2020
Explanation not yet available.